中文 | English
JimuReport (Free Report Tool)
v2.3.4 | 2026-05-21
![]()
![]()
![]()
![]()
![]()


Free AI visualization reporting. Describe your needs in one sentence and AI generates reports and data screens automatically; it also offers an Excel-like drag-and-drop designer compatible with 30+ data sources, easily handling all kinds of complex reporting scenarios — a cost-effective open-source alternative to FineReport and Tableau. ✨

Contents
- Product Overview
- Background
- Why Choose JimuReport
- Quick Links
- Quick Integration
- Deployment & Running
- AI-Powered Generation
- Database Compatibility
- Feature List
- Screenshots
- License
- Donation
- Disclaimer
Product Overview
JimuReport is a free data visualization reporting tool that brings reports, printing, big screens, and dashboards together — design entirely online, like building with blocks. It consists of two modules: JimuReport focuses on traditional complex reports and printing, while JimuBI focuses on big-screen and dashboard visualization.
- AI-Powered Generation: Built-in Claude Code skills (AI report / big screen / dashboard) generate professional visualization pages from a single sentence — no more tedious drag-and-drop.
- Excel-like Designer: Web-based drag-and-drop design, WYSIWYG, focused on solving enterprise-grade complex reporting challenges.
- Enterprise Advanced Features: grouping / cross-tab / master-detail reports, multi-sheet reports, data drill-down, one-click printing, form-overlay & invoice printing, data filling, mobile reports, QR/barcodes, and more.
- Full-Scenario Coverage: JimuBI supports big screens, dashboards, portals, and mobile — develop once, adapt everywhere; big screens use a Word-like style with freely draggable components.
- Simple · Easy · Professional: greatly lowers report development difficulty, shortens development cycles, and saves costs.
Open Source First — building "professional, easy-to-use, AI-intelligent" data visualization reports, big screens, and portals
One-Sentence AI Generation — AI Report · AI Big Screen · AI Dashboard
License — free to use, commercial use allowed, source code not open
Background
Reports are an indispensable part of enterprise IT, yet the industry has long lacked a tool that is both free and genuinely good — free options are mostly weak and not intelligent enough, while commercial reports are expensive. That is exactly why we set out to build a free reporting tool.
So what kind of report should it be? With the rise of low-code, the traditional model of designing templates in a tool and then integrating them with systems has become outdated. What we pursue is fully online design with visual, zero-barrier operation — truly simple, easy to use, and intelligent.
And with the arrival of the AI wave, JimuReport goes a step further by introducing AI capabilities — built-in Claude Code skills let you generate reports, big screens, and dashboards from a single sentence, shifting report design from "dragging" to "conversation" for true intelligence and efficiency.
Why Choose JimuReport
Permanently free · AI-intelligent · full-scenario — generate reports from a single sentence, design with Excel-like drag-and-drop, with 30+ data sources, complex reports, precise printing, data filling, big screens and dashboards all in one. The reporting tool of choice for the low-code era!
- Quick Integration: works with any SpringBoot scaffold project.
- AI-Powered: built-in Claude Code skills (AI report / big screen / dashboard) generate editable visualization pages from a single sentence or a screenshot.
- Excel-like Designer: web drag-and-drop, WYSIWYG; supports multi-sheet, unlimited rows/columns, frozen panes, plus report functions like SUMIFS / VLOOKUP / IF with automatic totals.
- Complex Reports: full coverage of grouping, cross-tab, master-detail, detail, multi-header, data drill-down, alerts, conditional query, and QR/barcode reports.
- Data Binding & Big Data: compatible with 30+ data sources (MySQL, Oracle, DM, KingbaseES, plus Hive, ClickHouse, Doris, ES, MongoDB, files / multi-files, etc.), with SQL / API / JSON / WebSocket multi-source binding and chart linkage & drill-down.
- Localization (Xinchuang): full support for the Xinchuang ecosystem, adapting to domestic databases such as DM, KingbaseES, ShenTong, and Huawei GaussDB, and running on domestic operating systems like Kylin and UOS.
- Precise Printing & Form Filling: form-overlay and background printing, seamless invoice/certificate printing; online form filling with write-back to the database; export to Excel / PDF / Word / image.
- Big Screens & Dashboards: ECharts with 28+ chart types, Word-style drag-and-drop big screens, 24-column grid dashboards, paired with portal business boards.
- Mobile & Full-Scenario: reports, big screens, and dashboards — develop once, adapt to PC / mobile / big screen / portal.
Quick Links
| Resource | URL |
|---|---|
| 🏠 Official Website | http://jimureport.com |
| 🎯 Online Demo | http://jimureport.com/login (one-click mobile registration, free to use) |
| 📖 Documentation | https://help.jimureport.com |
| 🤖 AI Capabilities | https://help.jimureport.com/rumen/aiAssistant/ |
| 🧩 Skills Repository | https://github.com/jeecgboot/skills |
| 🎬 Video Tutorials | http://jimureport.com/doc/video |
| 🐛 Issues | https://github.com/jeecgboot/JimuReport/issues/new |
| 💬 QQ Groups | 873666520, 854804538(full), ③596660273(full), ①212391162(full), ②929646317(full) |
Quick Integration
Supports quick integration into SpringBoot scaffold projects. SpringBoot3 requires JDK17+, SpringBoot2 requires JDK8+. See the integration docs for details.
Step 1: Add JimuReport Dependencies
- springboot3
 <dependency>
    <groupId>org.jeecgframework.jimureport</groupId>
    <artifactId>jimureport-spring-boot3-starter</artifactId>
    <version>2.3.4</version>
 </dependency>
 <!-- MongoDB, Redis, and file dataset support package, add as needed -->
 <dependency>
    <groupId>org.jeecgframework.jimureport</groupId>
    <artifactId>jimureport-nosql-starter3</artifactId>
    <version>2.3.0</version>
 </dependency>
 <!-- Backend export interface ECharts support package, add as needed -->
 <dependency>
    <groupId>org.jeecgframework.jimureport</groupId>
    <artifactId>jimureport-echarts-starter</artifactId>
    <version>2.3.0</version>
 </dependency>
- springboot2
 <dependency>
    <groupId>org.jeecgframework.jimureport</groupId>
    <artifactId>jimureport-spring-boot-starter</artifactId>
    <version>2.3.4</version>
 </dependency>
 <dependency>
    <groupId>org.jeecgframework.jimureport</groupId>
    <artifactId>jimureport-nosql-starter</artifactId>
    <version>2.1.0</version>
 </dependency>
 <dependency>
    <groupId>org.jeecgframework.jimureport</groupId>
    <artifactId>jimureport-echarts-starter</artifactId>
    <version>2.3.0</version>
 </dependency>
Step 2: Add JimuBI Dependencies (Dashboards and Big Screens)
- springboot3
<dependency>
  <groupId>org.jeecgframework.jimureport</groupId>
  <artifactId>jimubi-spring-boot3-starter</artifactId>
  <version>2.3.2</version>
</dependency>
- springboot2
 <dependency>
   <groupId>org.jeecgframework.jimureport</groupId>
   <artifactId>jimubi-spring-boot-starter</artifactId>
   <version>2.3.2</version>
 </dependency>
Step 3: Initialize SQL and Required Configuration
Deployment & Running
jimureport-example Environment Requirements
- Requires JDK17+ (this project uses SpringBoot3 architecture)
- Requires MySQL 5.7+; manually execute
db/jimureport.mysql5.7.create.sql, which automatically creates the jimureport database - Project configuration:
src/main/resources/application-dev.yml - Requires Redis (optional)
Green Installation-Free Version
Default account / password: admin / 123456, password change supported
AI-Powered Generation
A collection of JimuReport Claude Code skills: describe your needs in one sentence and AI generates AI reports, AI big screens, and AI dashboards, covering the full data-visualization spectrum — no more tedious drag-and-drop.
🚀 One-Click Install: Claude Code + JimuReport Skills
Option 1: Install the full environment with a single command
Mirror-accelerated for users in China. Installs Node.js, Python 3.12+, Git, Claude Code, and JimuReport Skills in one go, and connects DeepSeek v4 as the model backend (billed per token, bring your own API Key). Ready to use once it finishes.
Windows (PowerShell):
irm https://www.qiaoqiaoyun.com/claude/boot.ps1 | iex
macOS / Linux:
curl -fsSL https://www.qiaoqiaoyun.com/claude/install-claude-code.sh | bash
Option 2: Already have Claude Code, install Skills only
git clone https://github.com/jeecgboot/skills.git ~/.claude/skills
# Update: cd ~/.claude/skills && git pull
Once installed, open a new terminal and run claude to generate reports and big screens with natural language.
Skills repository: https://github.com/jeecgboot/skills · Skills website: https://jimureport.com/skills
📦 Skills Catalog
| Skill | Purpose | One-Sentence Example |
|---|---|---|
jimureport |
Generate a report from one sentence | Create a salary statistics report grouped by department |
jimubi-bigscreen |
Generate a big screen from one sentence | Create a smart logistics monitoring big screen |
jimubi-dashboard |
Generate a dashboard / portal from one sentence | Generate a sales operations KPI board |
Prompt examples: AI Reports · AI Big Screens
Database Compatibility
Supports 30+ data sources including Xinchuang/localized databases, conventional databases, and NoSQL. Fully adapts to domestic databases such as DM, KingbaseES, ShenTong, and Huawei GaussDB, and supports querying non-physical databases like CSV and MongoDB via SQL.
| Database | Support |
|---|---|
| MySQL | √ |
| Oracle, Oracle9i | √ |
| SqlServer, SqlServer2012 | √ |
| PostgreSQL | √ |
| DB2, Informix | √ |
| MariaDB | √ |
| SQLite, Hsqldb, Derby, H2 | √ |
| DM, KingbaseES, ShenTong | √ |
| Huawei GaussDB, XuGu, HighGo, TDengine | √ |
| Alibaba Cloud PolarDB, PPAS, HerdDB | √ |
| Hive, HBase, CouchBase | √ |
| Import Excel, CSV, JSON file datasets | √ |
| SQLite, TiDB, Doris, ClickHouse, MongoDB-BI | √ |
| Elasticsearch, MongoDB | √ |
For databases without provided scripts, refer to the documentation to convert them yourself.
Feature List
More feature list: http://jimureport.com/plan
📊 Report Designer Feature List (click to expand)
├─Report Designer
│  ├─AI Intelligent Generation
│  │  ├─Generate reports from a single sentence (Claude Code skills)
│  │  ├─Recognize a screenshot and restore it into an editable template
│  ├─Data Source / Dataset
│  │  ├─Supports multiple data sources such as Oracle, MySQL, SQLServer, PostgreSQL and other mainstream databases
│  │  ├─Supports intelligent SQL writing pages, showing table lists and field lists under data sources
│  │  ├─SQL dataset
│  │  ├─API dataset (fetch data via interface)
│  │  ├─JSON dataset
│  │  ├─Stored procedure dataset
│  │  ├─Supports parameters
│  │  ├─Supports single and multiple data source settings
│  │  ├─Multi-source report (one report joining multiple datasets across databases)
│  ├─Cell Format
│  │  ├─Borders
│  │  ├─Font size
│  │  ├─Font color
│  │  ├─Background color
│  │  ├─Font bold
│  │  ├─Supports horizontal and vertical distributed alignment
│  │  ├─Supports automatic text wrapping settings
│  │  ├─Set images as image backgrounds
│  │  ├─Supports unlimited rows and columns
│  │  ├─Supports frozen windows within the designer
│  │  ├─Supports copying, pasting, and deleting cell content or format
│  │  ├─And more
│  ├─Report Elements
│  │  ├─Text type: Write text directly; supports setting decimal places for numeric text
│  │  ├─Image type: Supports uploading an image
│  │  ├─Chart type
│  │  ├─Function type
│  │  └─Supports sum
│  │  └─Average
│  │  └─Maximum
│  │  └─Minimum
│  ├─Background
│  │  ├─Background color settings
│  │  ├─Background image settings
│  │  ├─Background transparency settings
│  │  ├─Background size settings
│  ├─Data Dictionary
│  ├─Report Printing
│  │  ├─Custom printing
│  │  └─Custom style design printing for medical prescriptions, arrest warrants, introduction letters, etc.
│  │  ├─Simple data printing
│  │  └─Inventory receipts, sales table printing
│  │  └─Parameterized printing
│  │  └─Paginated printing
│  │  ├─Form overlay printing
│  │  └─Real estate certificate printing
│  │  └─Invoice printing
│  ├─Data Reports
│  │  ├─Grouped data reports
│  │  └─Horizontal data grouping
│  │  └─Vertical data grouping
│  │  └─Multi-level loop header grouping
│  │  └─Horizontal grouping subtotals
│  │  └─Vertical grouping subtotals
│  │  └─Grand totals
│  │  ├─Cross-tabulation reports
│  │  ├─Detail tables
│  │  ├─Conditional query reports
│  │  ├─Expression reports
│  │  ├─QR code/barcode reports
│  │  ├─Multi-header complex reports
│  │  ├─Master-detail reports
│  │  ├─Alert reports
│  │  ├─Data drill-down reports
│  │  ├─Multi-sheet reports
│  ├─Data Filling
│  │  ├─Online form filling
│  │  ├─Write-back to database
│  │  ├─Filling validation rules
│  │  ├─Dropdown / dictionary / date filling controls
│  │  ├─Batch import of filling data
│  ├─Chart Reports
│  │  ├─Column charts
│  │  ├─Line charts
│  │  ├─Pie charts
│  │  ├─Combination charts
│  │  ├─Scatter plots
│  │  ├─Funnel charts
│  │  ├─Radar charts
│  │  ├─Pictorial charts
│  │  ├─Maps
│  │  ├─Gauges
│  │  ├─Relationship charts
│  │  ├─Chart backgrounds
│  │  ├─Dynamic chart refresh
│  │  ├─Chart data dictionary
│  ├─Parameters
│  │  ├─Parameter configuration
│  │  ├─Parameter management
│  ├─Import/Export
│  │  ├─Import Excel
│  │  ├─Export Excel, PDF, Word, image
│  ├─Print Settings
│  │  ├─Print area settings
│  │  ├─Printer settings
│  │  ├─Preview
│  │  ├─Print page number settings
│  ├─Mobile Adaptation
│  │  ├─Report / chart browsing on mobile
│  │  ├─Mobile form filling
│  ├─Advanced Features
│  │  ├─Scheduled data refresh
│  │  ├─Cell hyperlinks / jumps
│  │  ├─Drill-down linkage
│  │  ├─Data caching
│  │  ├─JS / backend enhancement
📺 Big Screen Designer Feature List (click to expand)
├─Large Screen Designer
│  ├─System Functions
│  │  ├─Static and dynamic data source settings
│  │  ├─Basic functions
│  │  └─Supports drag-and-drop design
│  │  └─Supports add, delete, modify, query large screens
│  │  └─Supports copying large screen data and styles
│  │  └─Supports large screen preview and sharing
│  │  └─Supports automatic data saving and manual data recovery
│  │  └─Supports setting large screen passwords
│  │  └─Supports deleting, grouping, moving up/down, bring to front/back for component layers
│  │  ├─Background Settings
│  │  └─Large screen width and height settings
│  │  └─Large screen description settings
│  │  └─Background color and background image settings
│  │  └─Cover image settings
│  │  └─Zoom ratio settings
│  │  └─Environment address settings
│  │  └─Watermark settings
│  │  ├─Map Settings
│  │  └─Add maps
│  │  └─Map data isolation
│  ├─Charts
│  │  ├─Column charts
│  │  ├─Line charts
│  │  ├─Combination charts
│  │  ├─Pie charts
│  │  ├─Pictorial charts
│  │  ├─Radar charts
│  │  ├─Scatter plots
│  │  ├─Funnel charts
│  │  ├─Text boxes
│  │  ├─Marquee
│  │  ├─Hyperlinks
│  │  ├─Real-time clock
│  │  ├─Maps
│  │  ├─National logistics map
│  │  ├─Geographic coordinate map
│  │  ├─City delivery map
│  │  ├─Images
│  │  ├─Image frames
│  │  ├─Carousel
│  │  ├─Slider components
│  │  ├─iframe
│  │  ├─video
│  │  ├─Flip counter
│  │  ├─Ring charts
│  │  ├─Progress bars
│  │  ├─Gauges
│  │  ├─Word cloud
│  │  ├─Tables
│  │  ├─Tabs
│  │  ├─Universal components
└─Other Modules
   └─More features in development...
📈 Dashboard Designer Feature List (click to expand)
├─Dashboard Designer
│  ├─Basic Functions
│  │  └─Supports drag-and-drop design
│  │  └─Supports add, delete, modify, query dashboards
│  │  └─Supports copying dashboard data and styles
│  │  └─Supports dashboard preview and sharing
│  │  └─Supports setting dashboard protection code
│  │  └─Supports setting dashboard PC mode or mobile mode
│  │  └─Supports adding, deleting, moving dashboard controls
│  ├─Data Sources
│  │  └─Supports multiple data sources such as Oracle, MySQL, SQLServer, PostgreSQL and other mainstream databases
│  │  └─Supports intelligent SQL writing pages, showing table lists and field lists under data sources
│  │  └─Supports parameters
│  ├─Data Sets
│  │  └─SQL
│  │  └─API
│  │  └─JSON
│  │  └─WebSocket
│  │  └─Static data sets
│  ├─Data
│  │  └─Set data count
│  │  └─Data filtering
│  │  └─Data auto-refresh
│  ├─Charts
│  │  └─Column charts
│  │  └─Pie charts
│  │  └─Nightingale rose charts
│  │  └─Line charts
│  │  └─Ring charts
│  │  └─Area charts
│  │  └─Progress charts
│  │  └─Pictorial charts
│  │  └─Gauges
│  │  └─Scatter plots
│  │  └─Funnel charts
│  │  └─Radar charts
│  ├─Common
│  │  └─Query conditions
│  │  └─Carousel
│  │  └─Iframe
│  │  └─Calendar
│  │  └─Images
│  │  └─Text
│  │  └─Numbers
│  │  └─Buttons
│  │  └─Current time
│  │  └─Rich text
│  ├─Layout
│  │  └─Tabs
│  │  └─Grid
│  ├─Data
│  │  └─Data tables
│  │  └─Data lists
│  │  └─Universal components
│  ├─Maps
│  │  └─Scatter maps
│  │  └─Flight line maps
│  │  └─Column maps
│  │  └─Timeline flight line maps
│  │  └─Column ranking maps
│  │  └─Heat maps
│  │  └─Regional maps
│  ├─Homepage
│  │  └─Quick navigation
│  │  └─Statistics cards
│  │  └─Project lists
│  │  └─Simple cards
│  │  └─To-do items
│  │  └─Latest activities
│  ├─Personality
│  │  └─Bull market surge
│  │  └─Five elements cycle
│  │  └─Gantt charts
│  ├─Style Configuration
│  │  └─Basic configuration
│  │  └─Title settings
│  │  └─Subtitle settings
│  │  └─X-axis settings
│  │  └─Y-axis settings
│  │  └─Tooltip settings
│  │  └─Coordinate axis margins
│  │  └─Legend settings
│  │  └─Custom color schemes
│  │  └─Card settings
│  │  └─Custom properties
│  │  └─Numerical settings
│  ├─Interaction Settings
│  │  └─Linkage configuration
│  │  └─Query configuration
│  │  └─Jump configuration
│  │  └─Drill-down configuration
│  │  └─Custom JS
└─ Export
    └─Images
    └─PDF
    └─Excel
Screenshots
Report Workbench
Report Designer · fully online design |
Chart Reports · 28+ chart types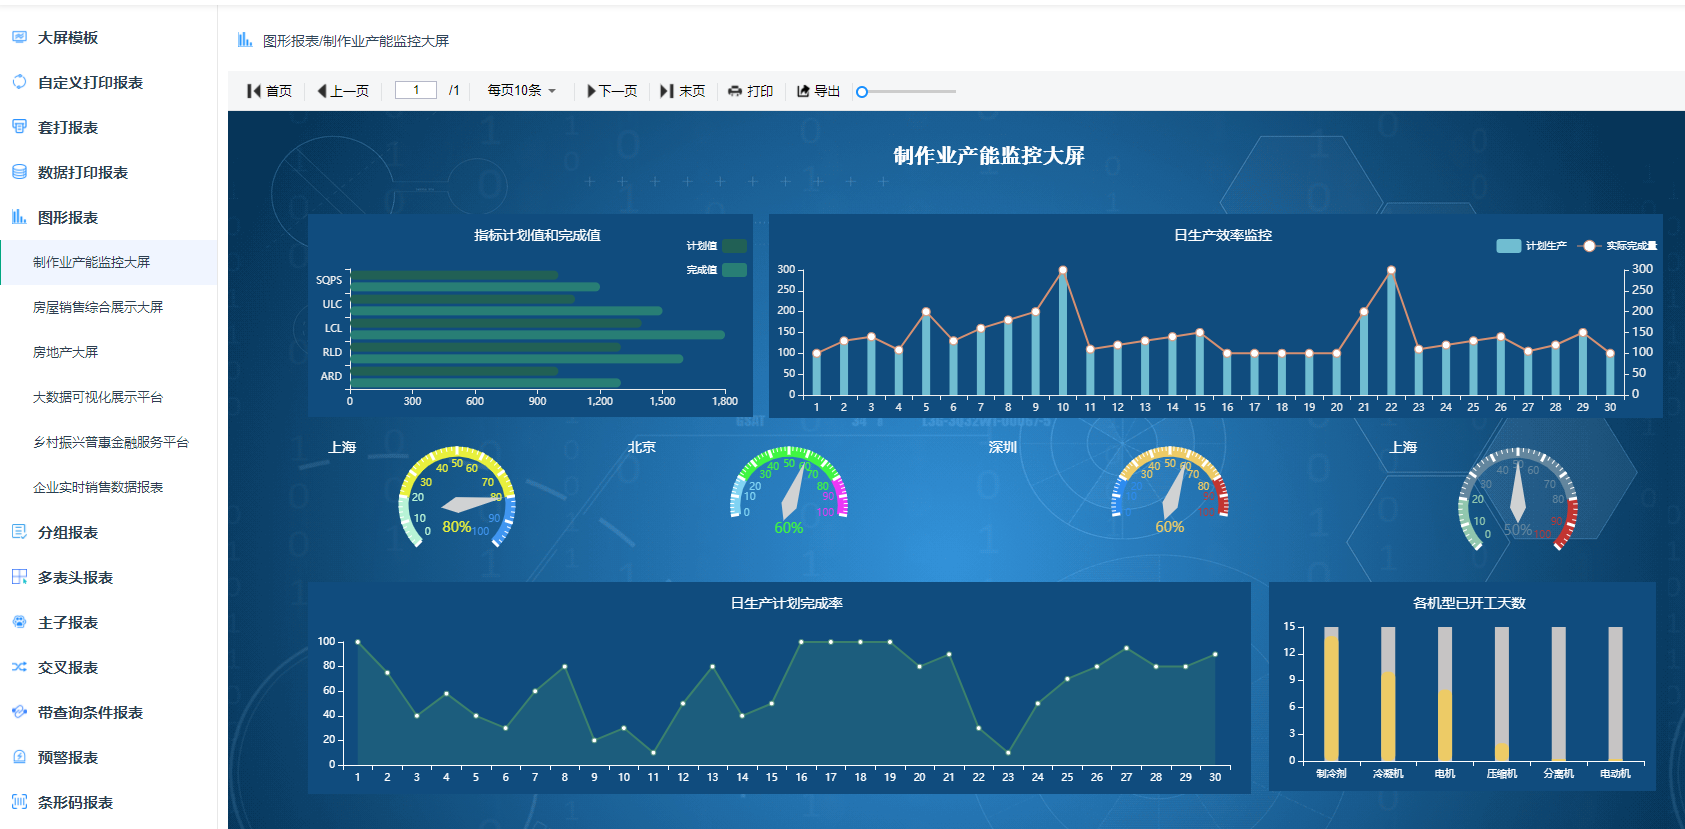 |
Data Reports · grouping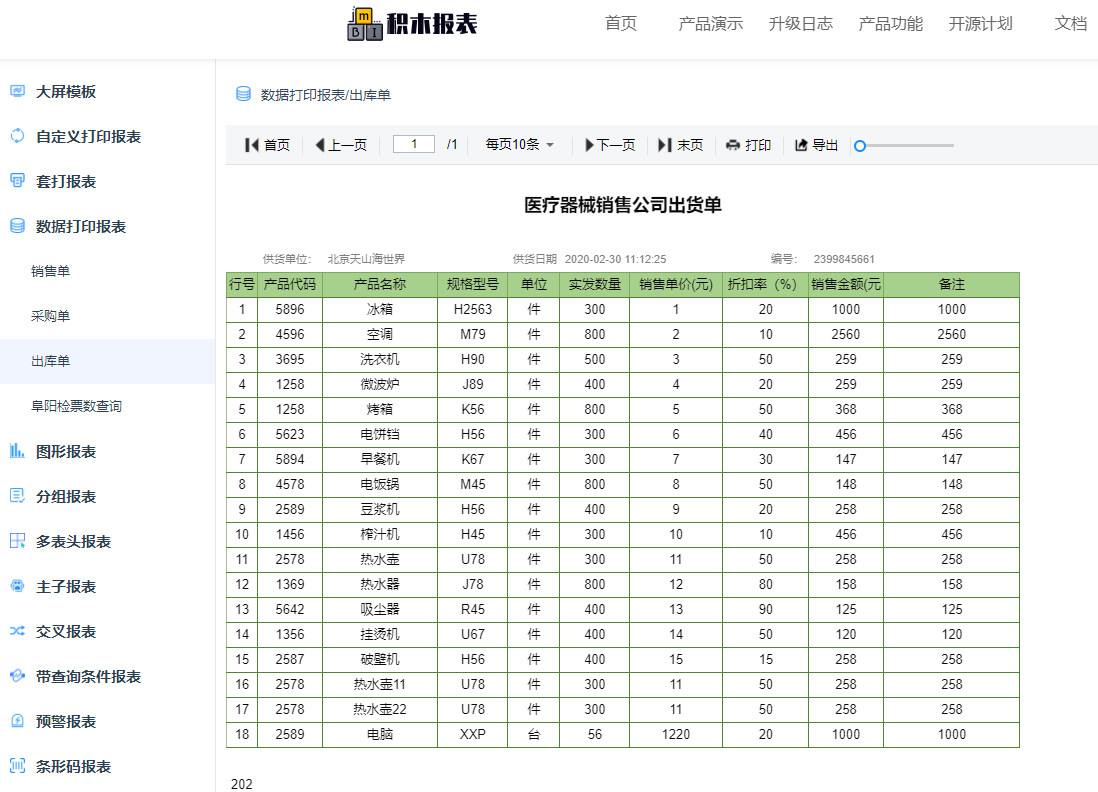 |
Print Design · form overlay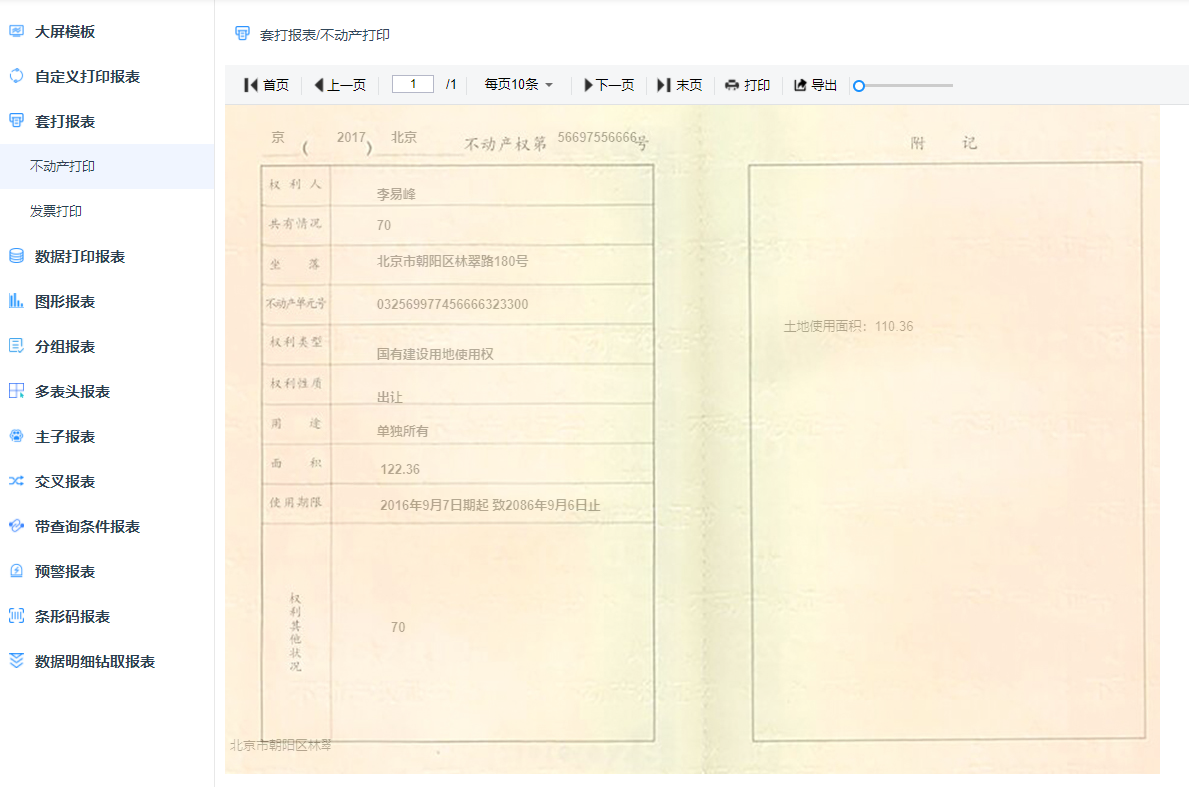 |
Data Reports · cross-tab / totals |
Chart Reports · 28 chart types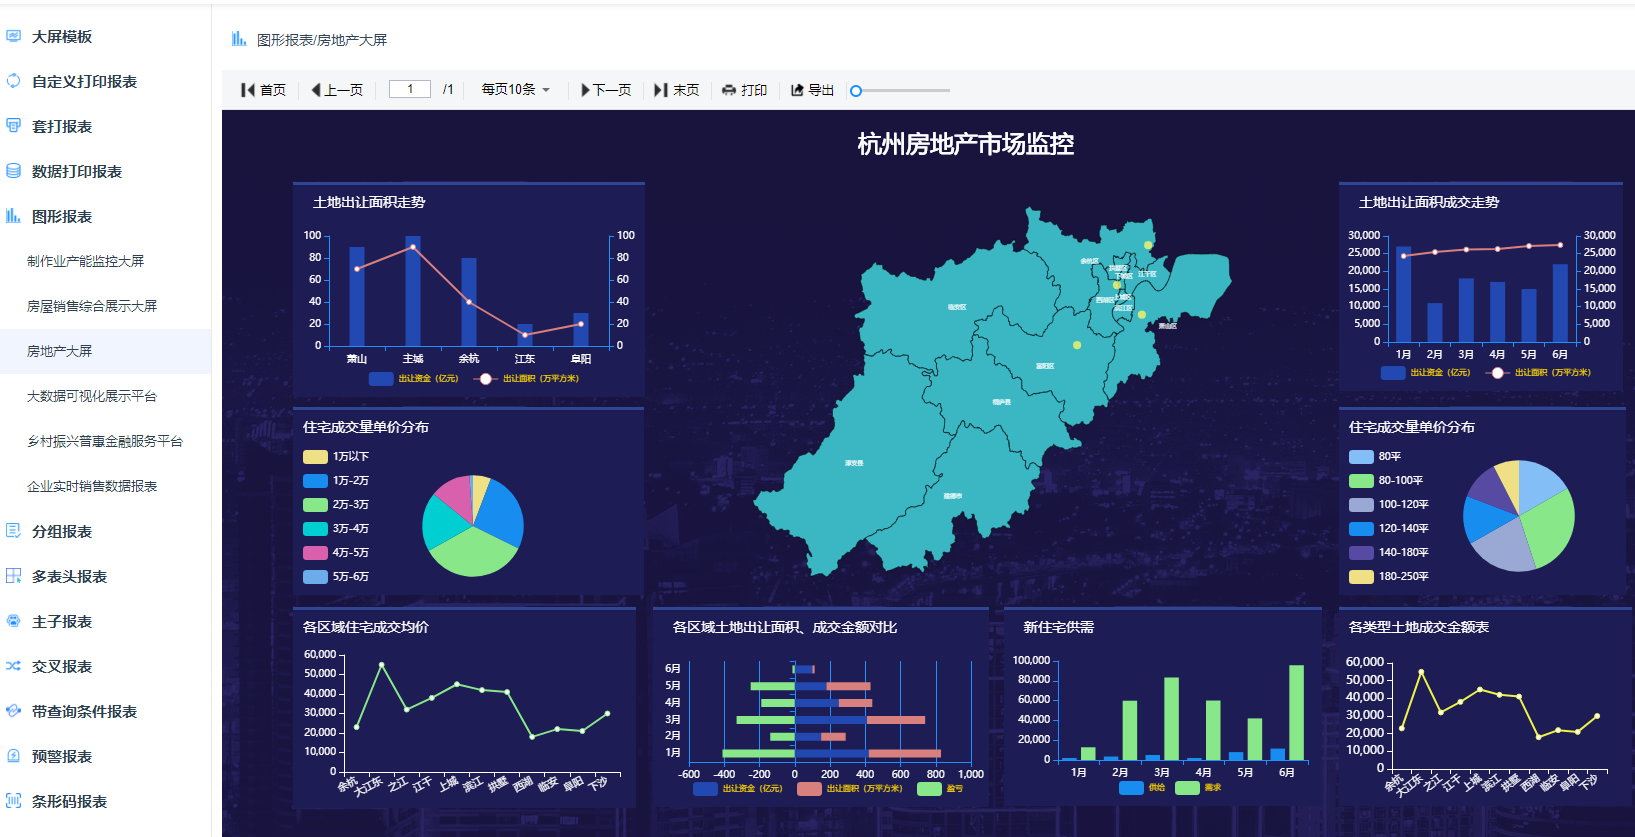 |
Print Design · hospital document printing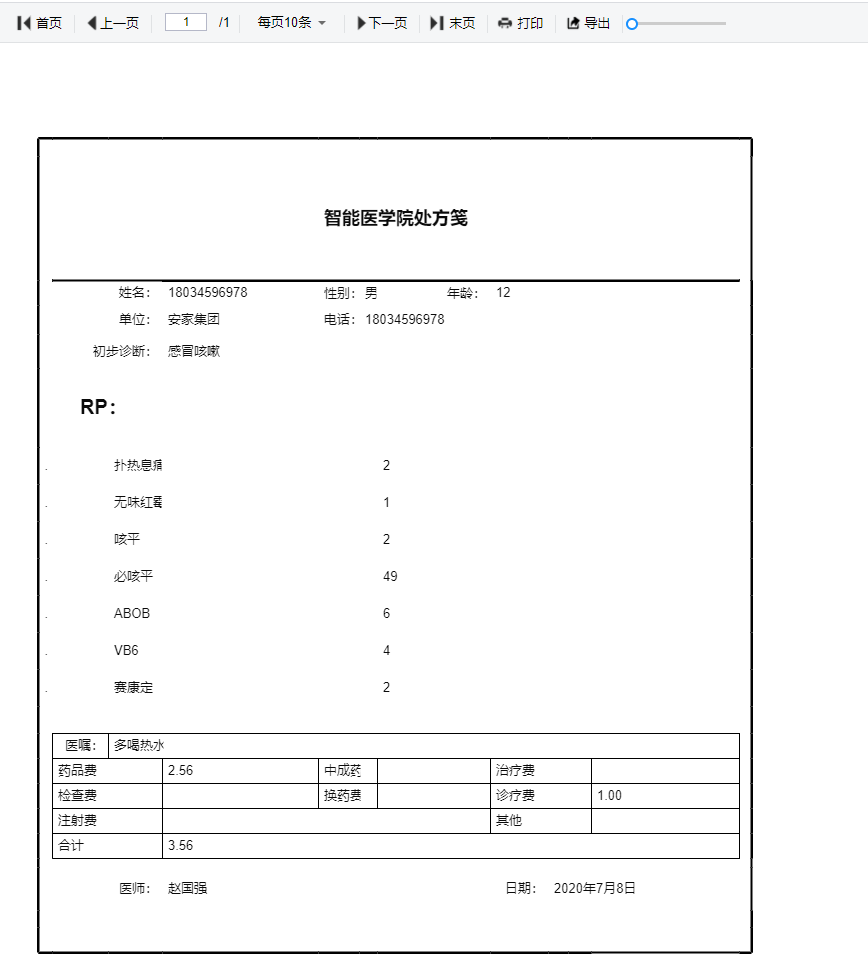 |
Form Filling · employee info form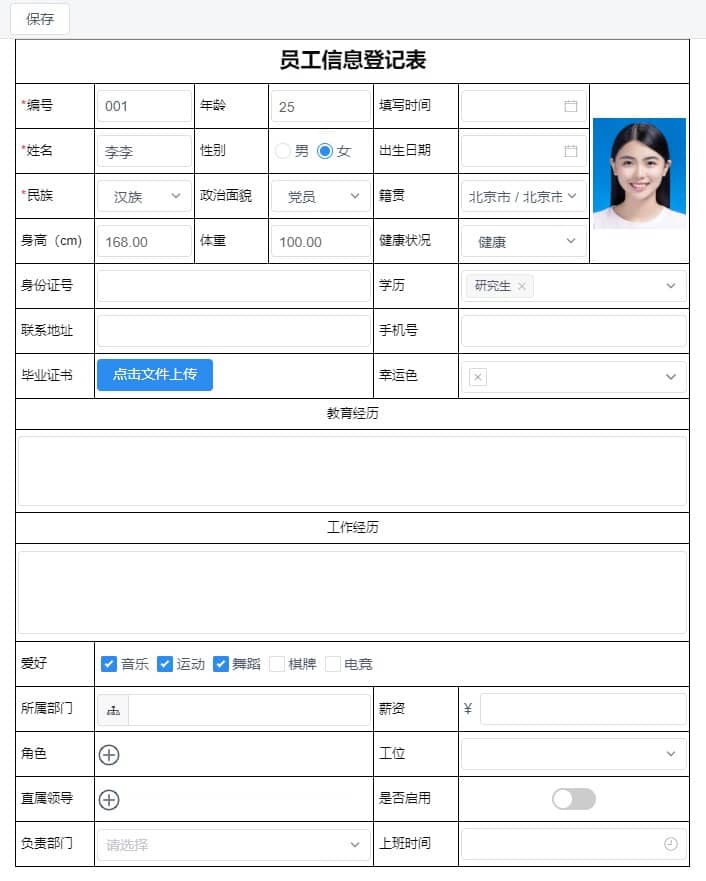 |
Form Filling · sales order form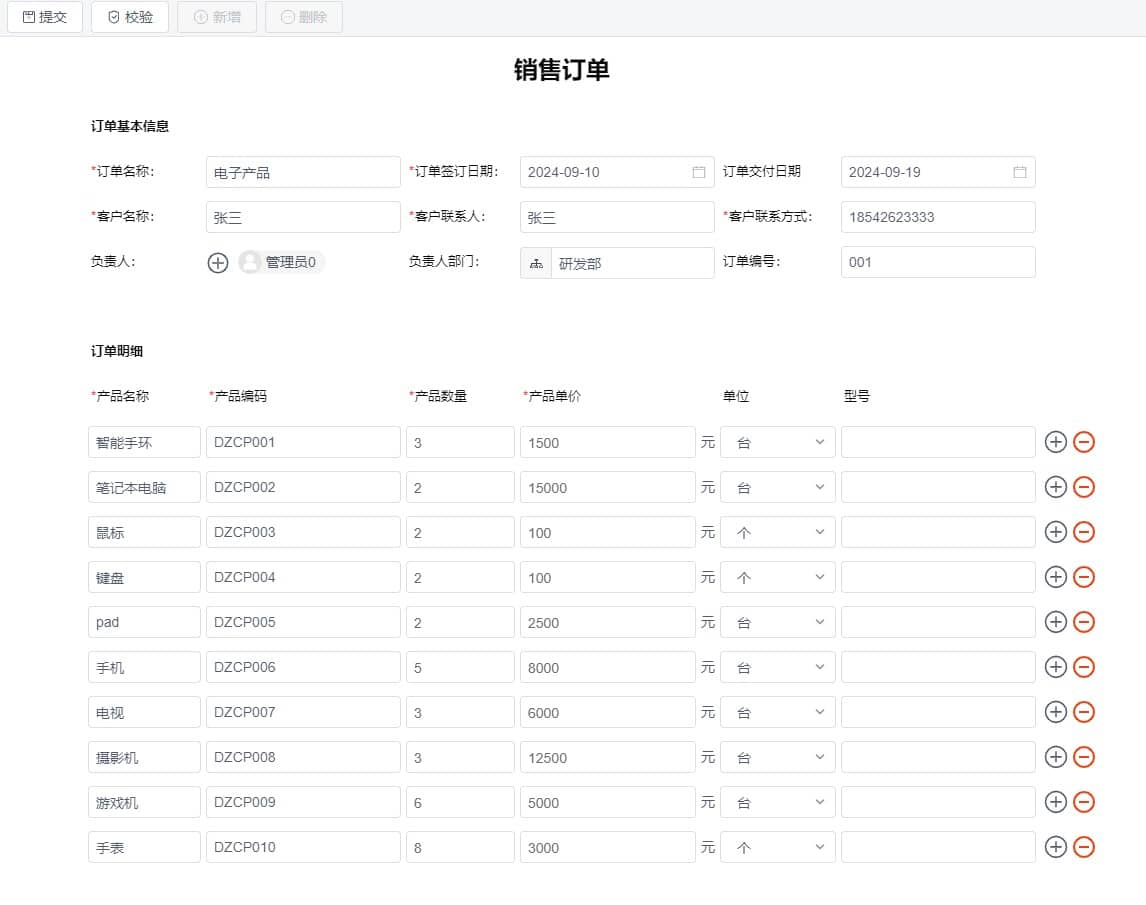 |
Form Filling · master-detail form |
Mobile Reports · mobile report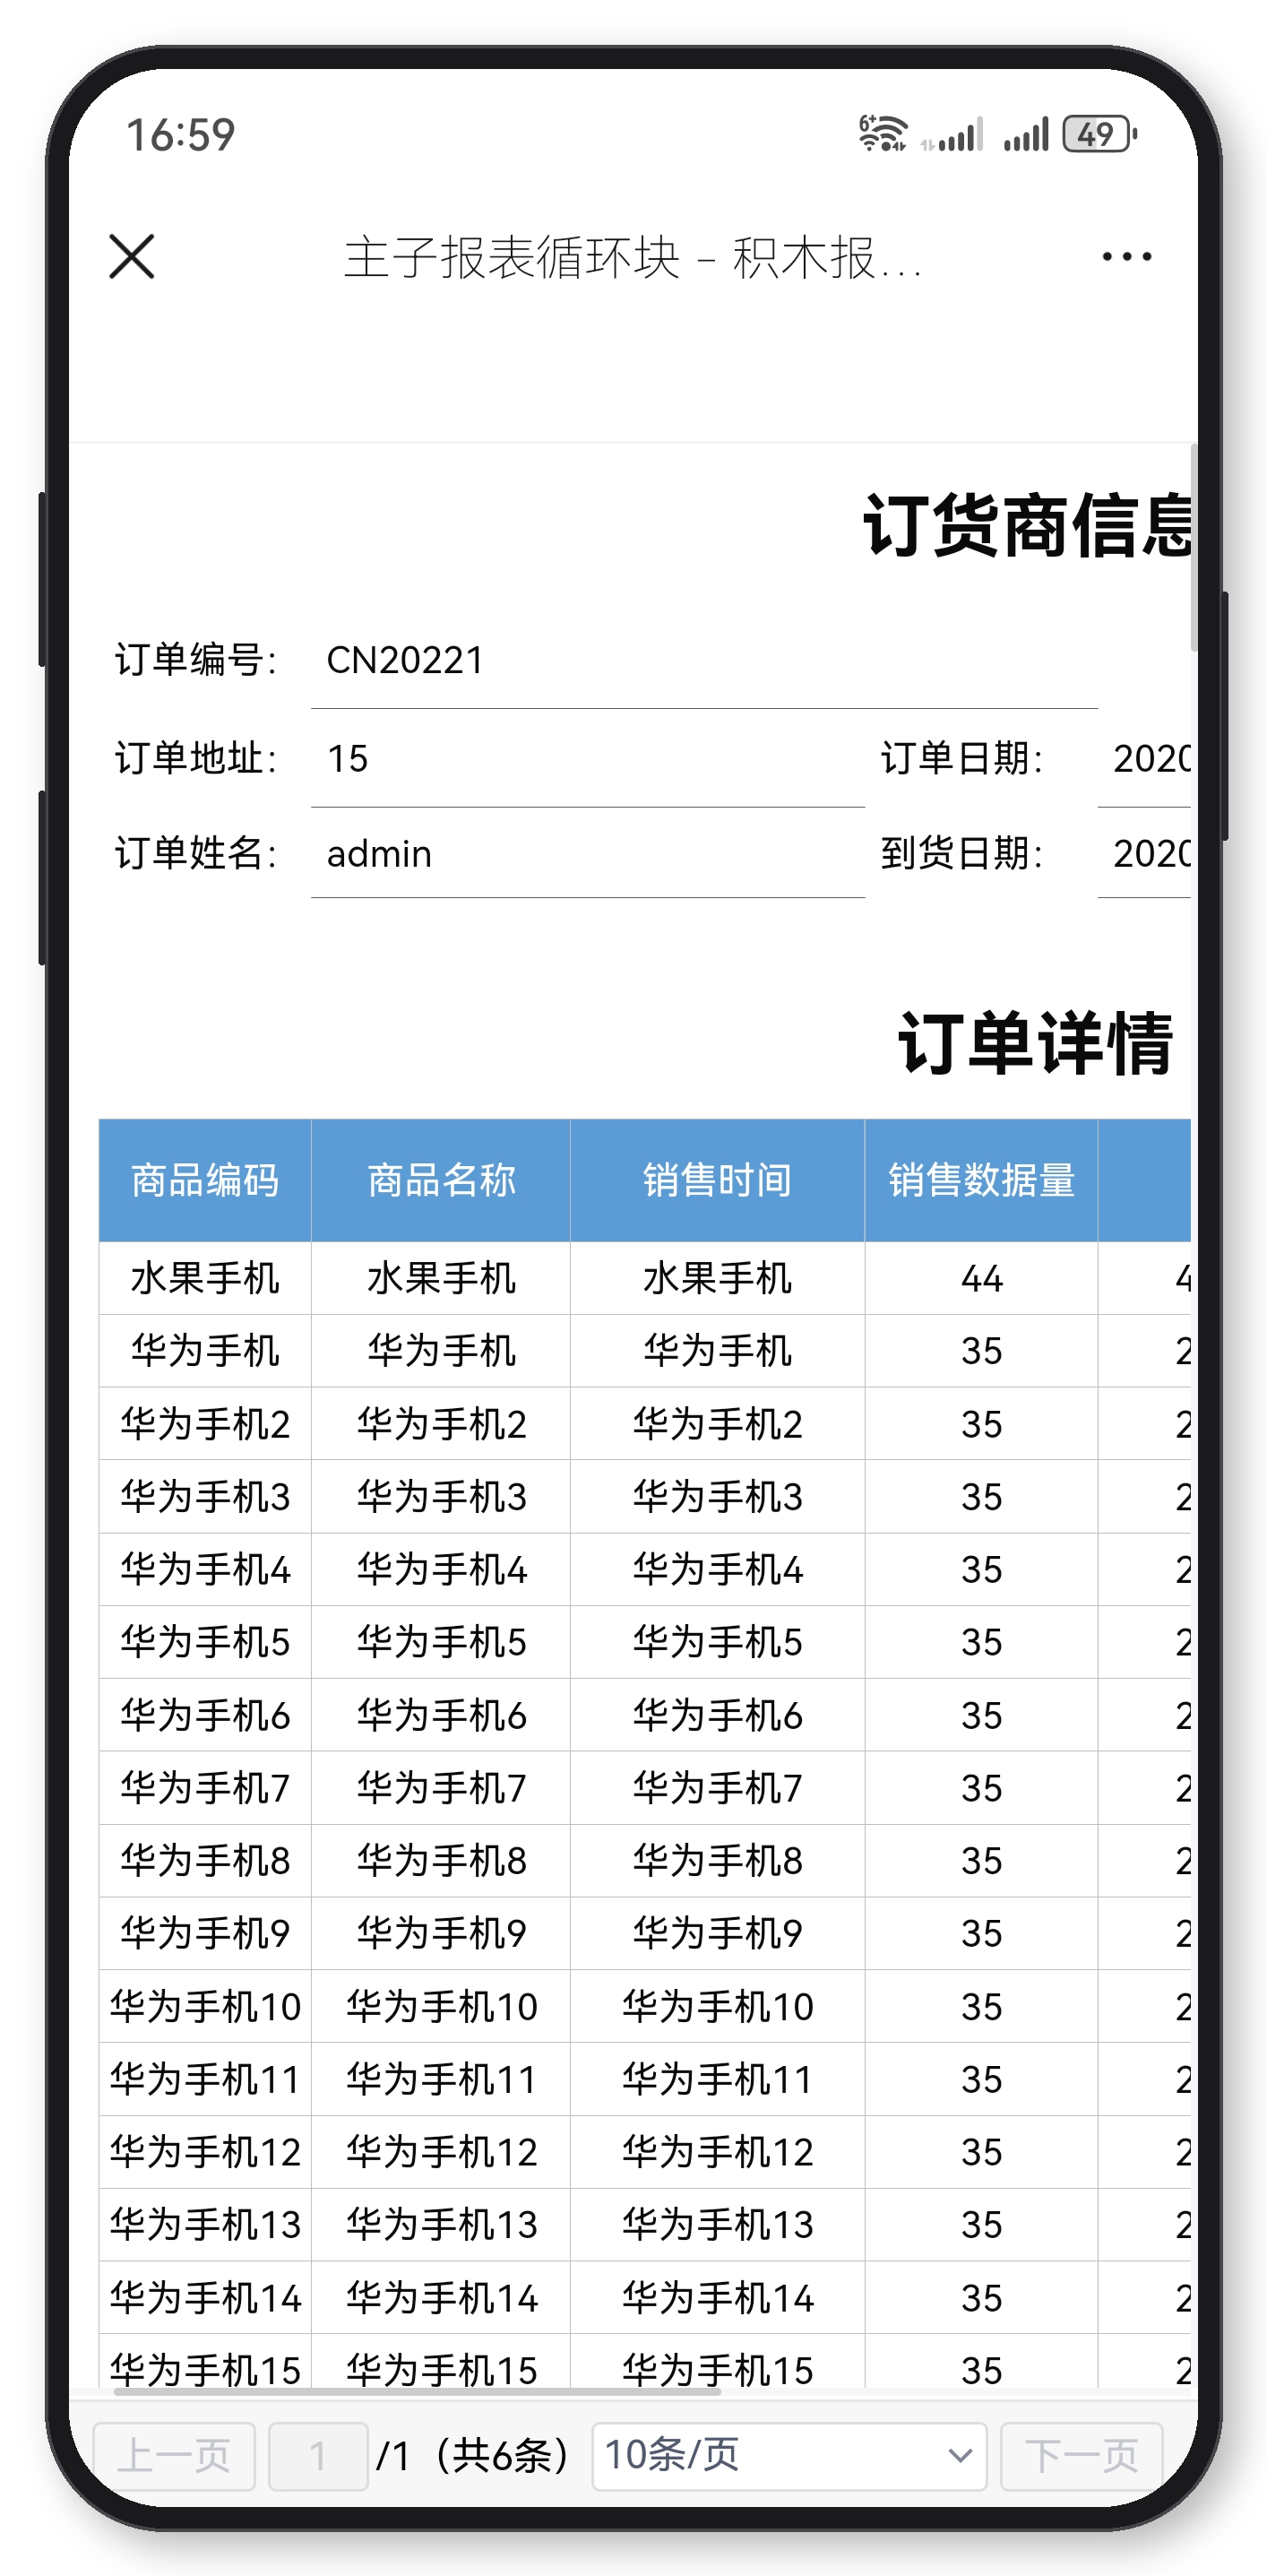 |
Mobile Reports · mobile charts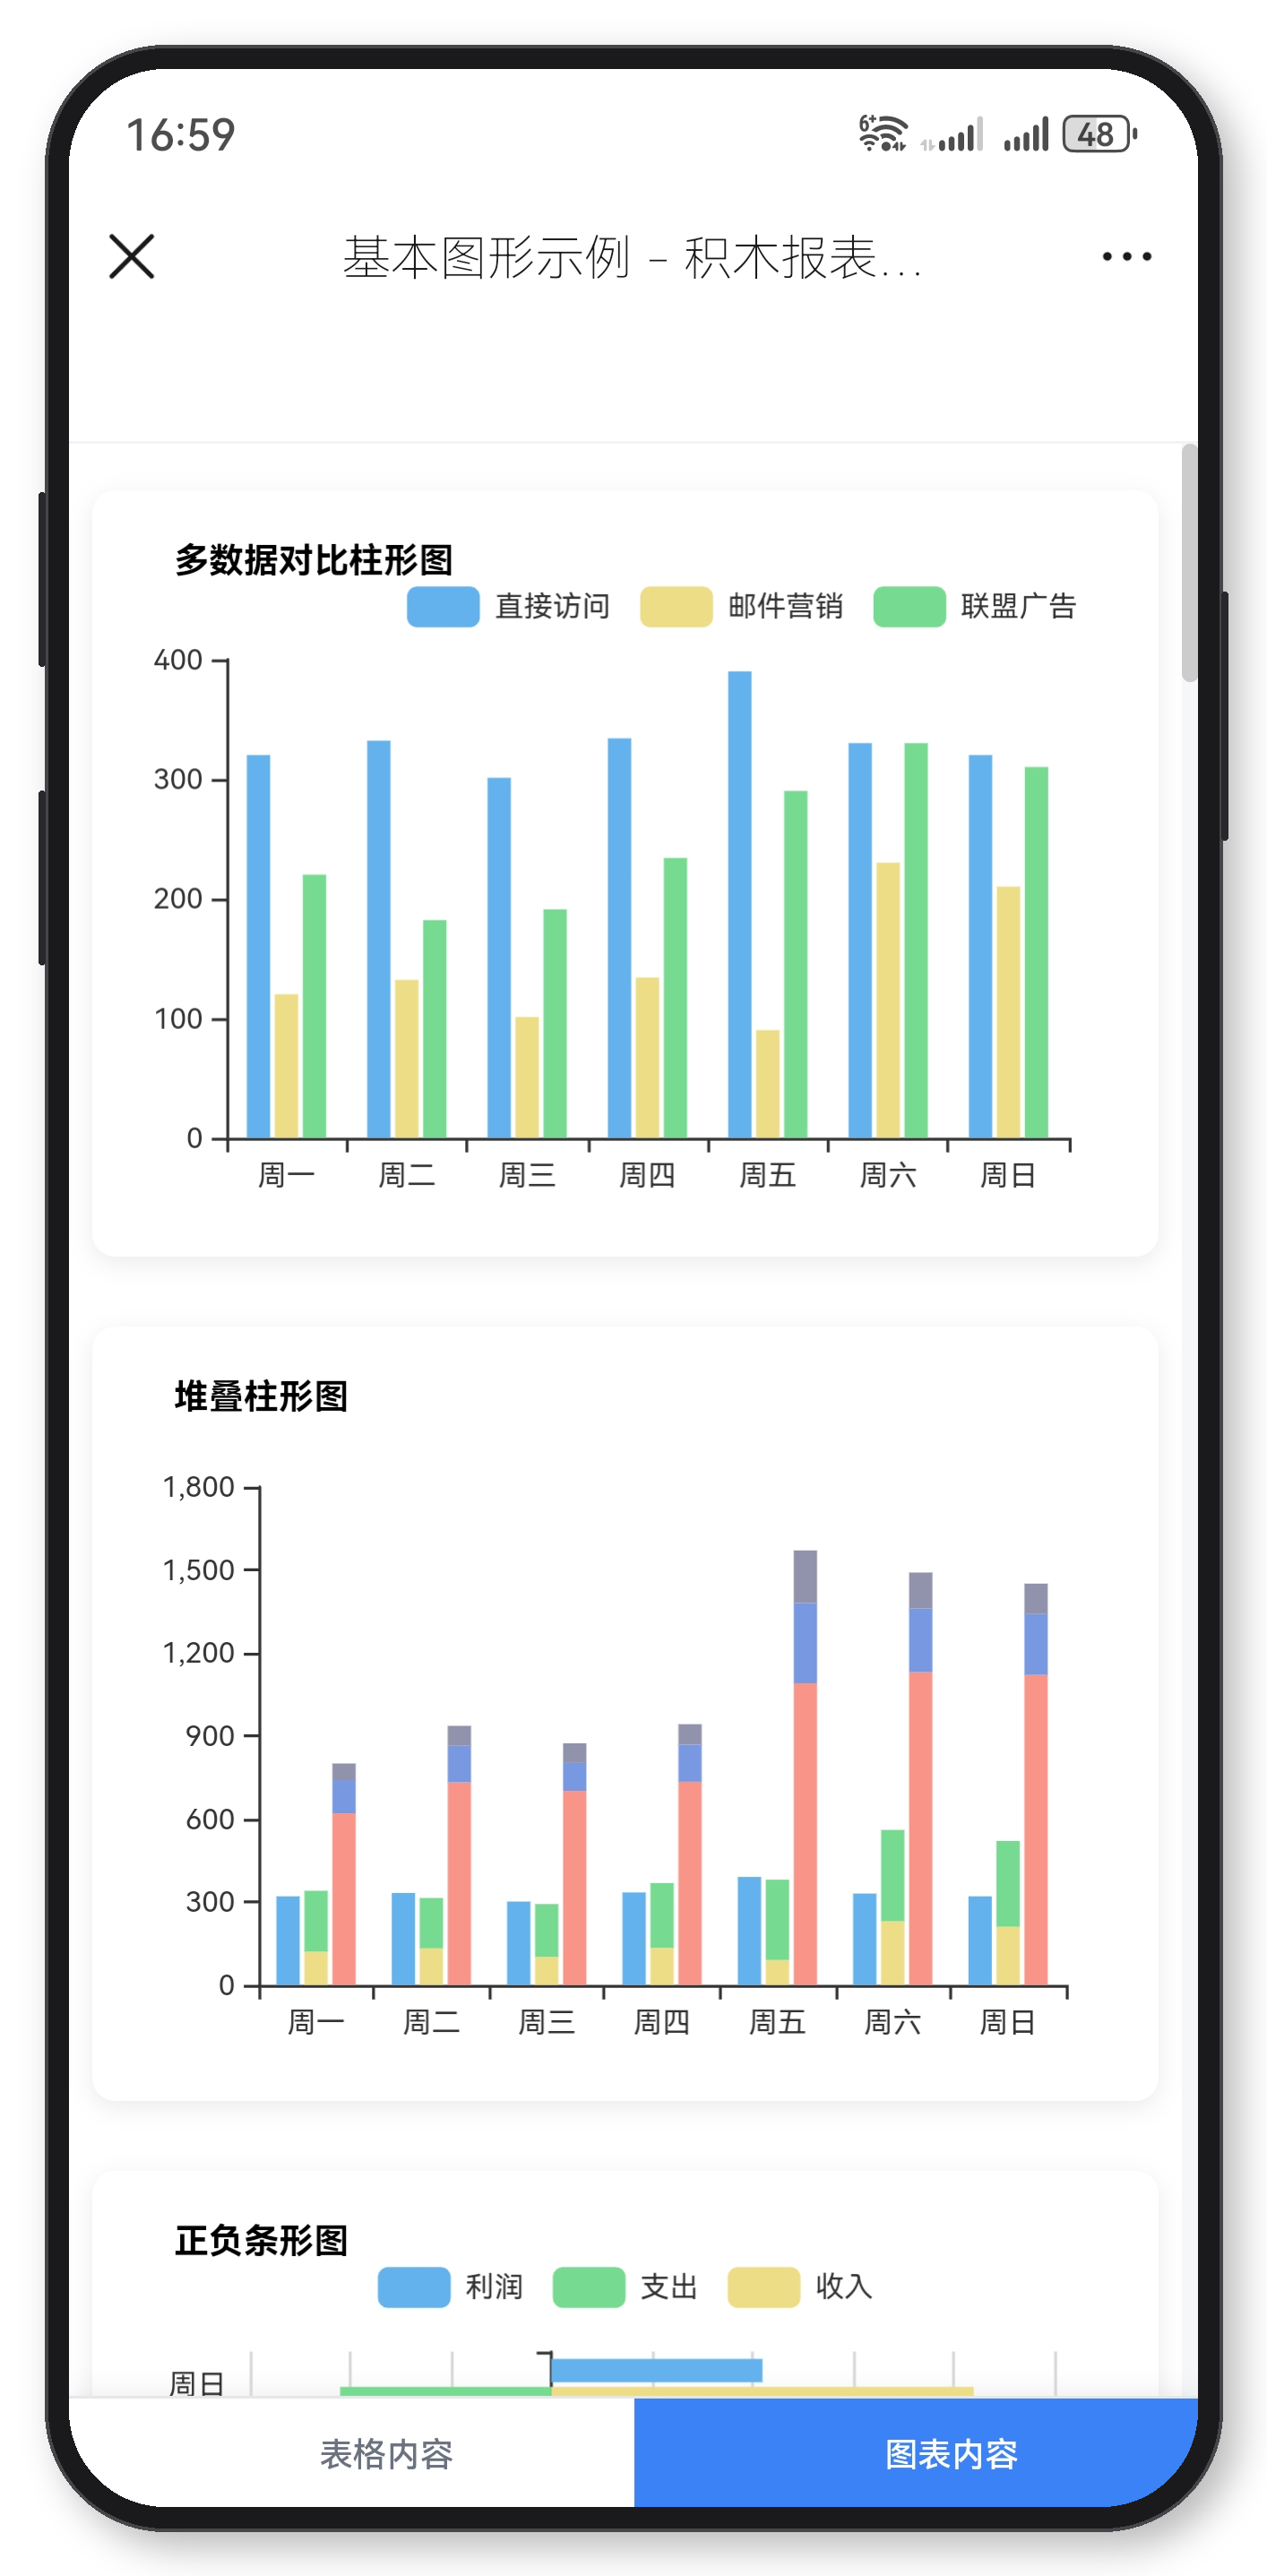 |
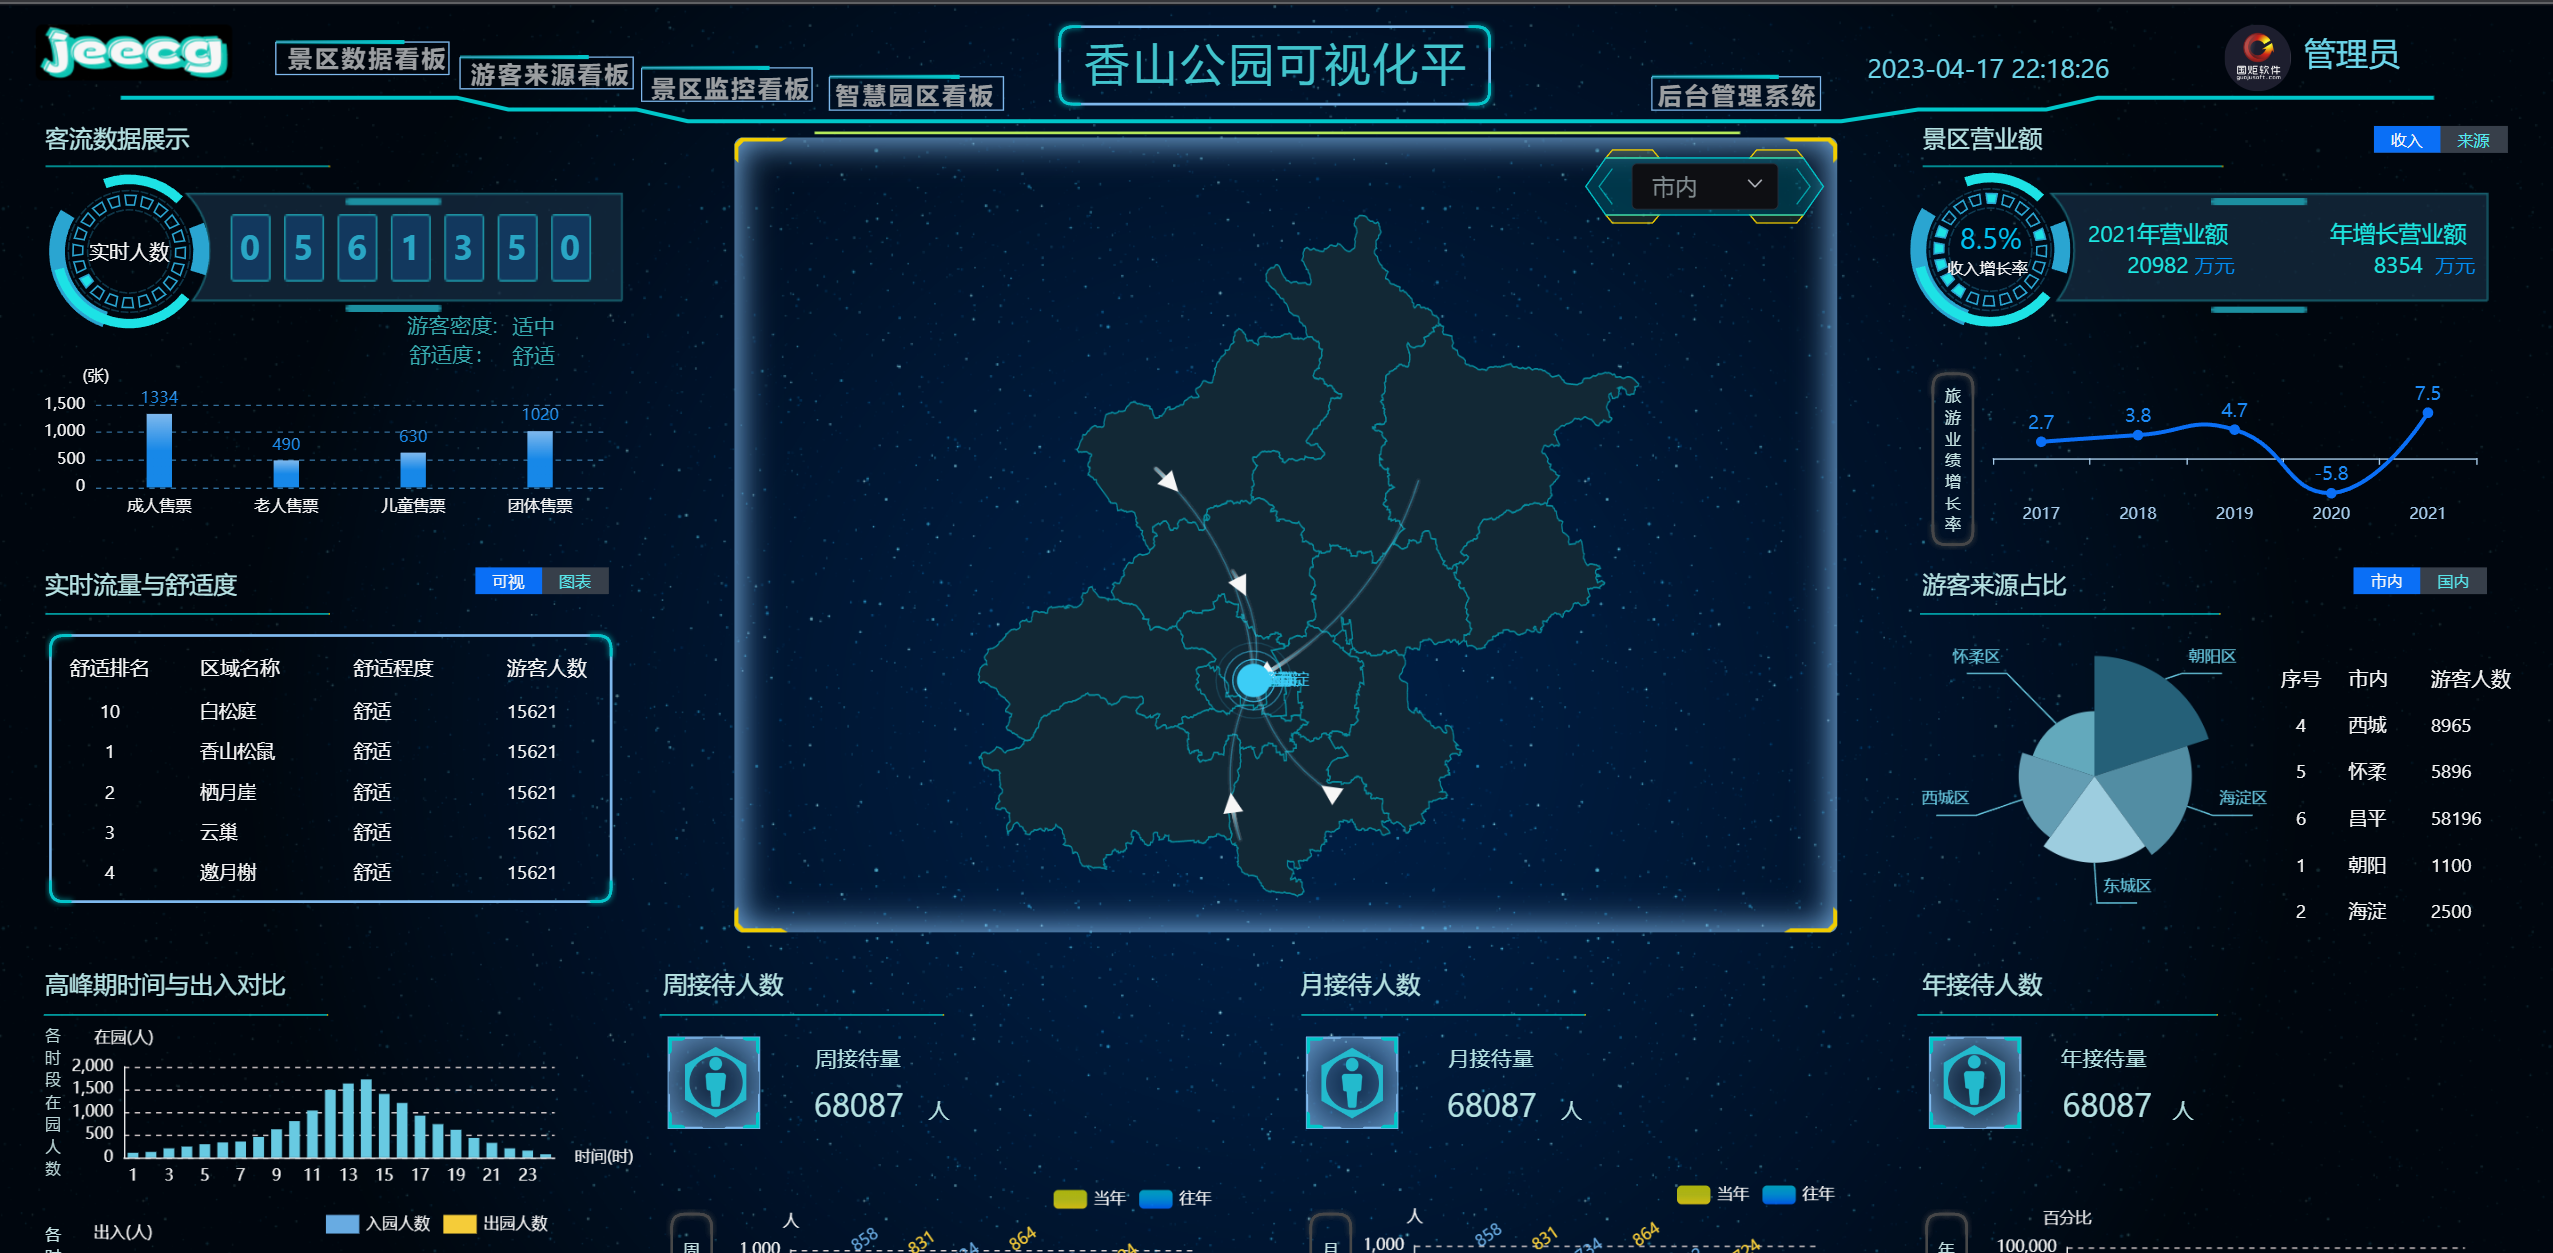
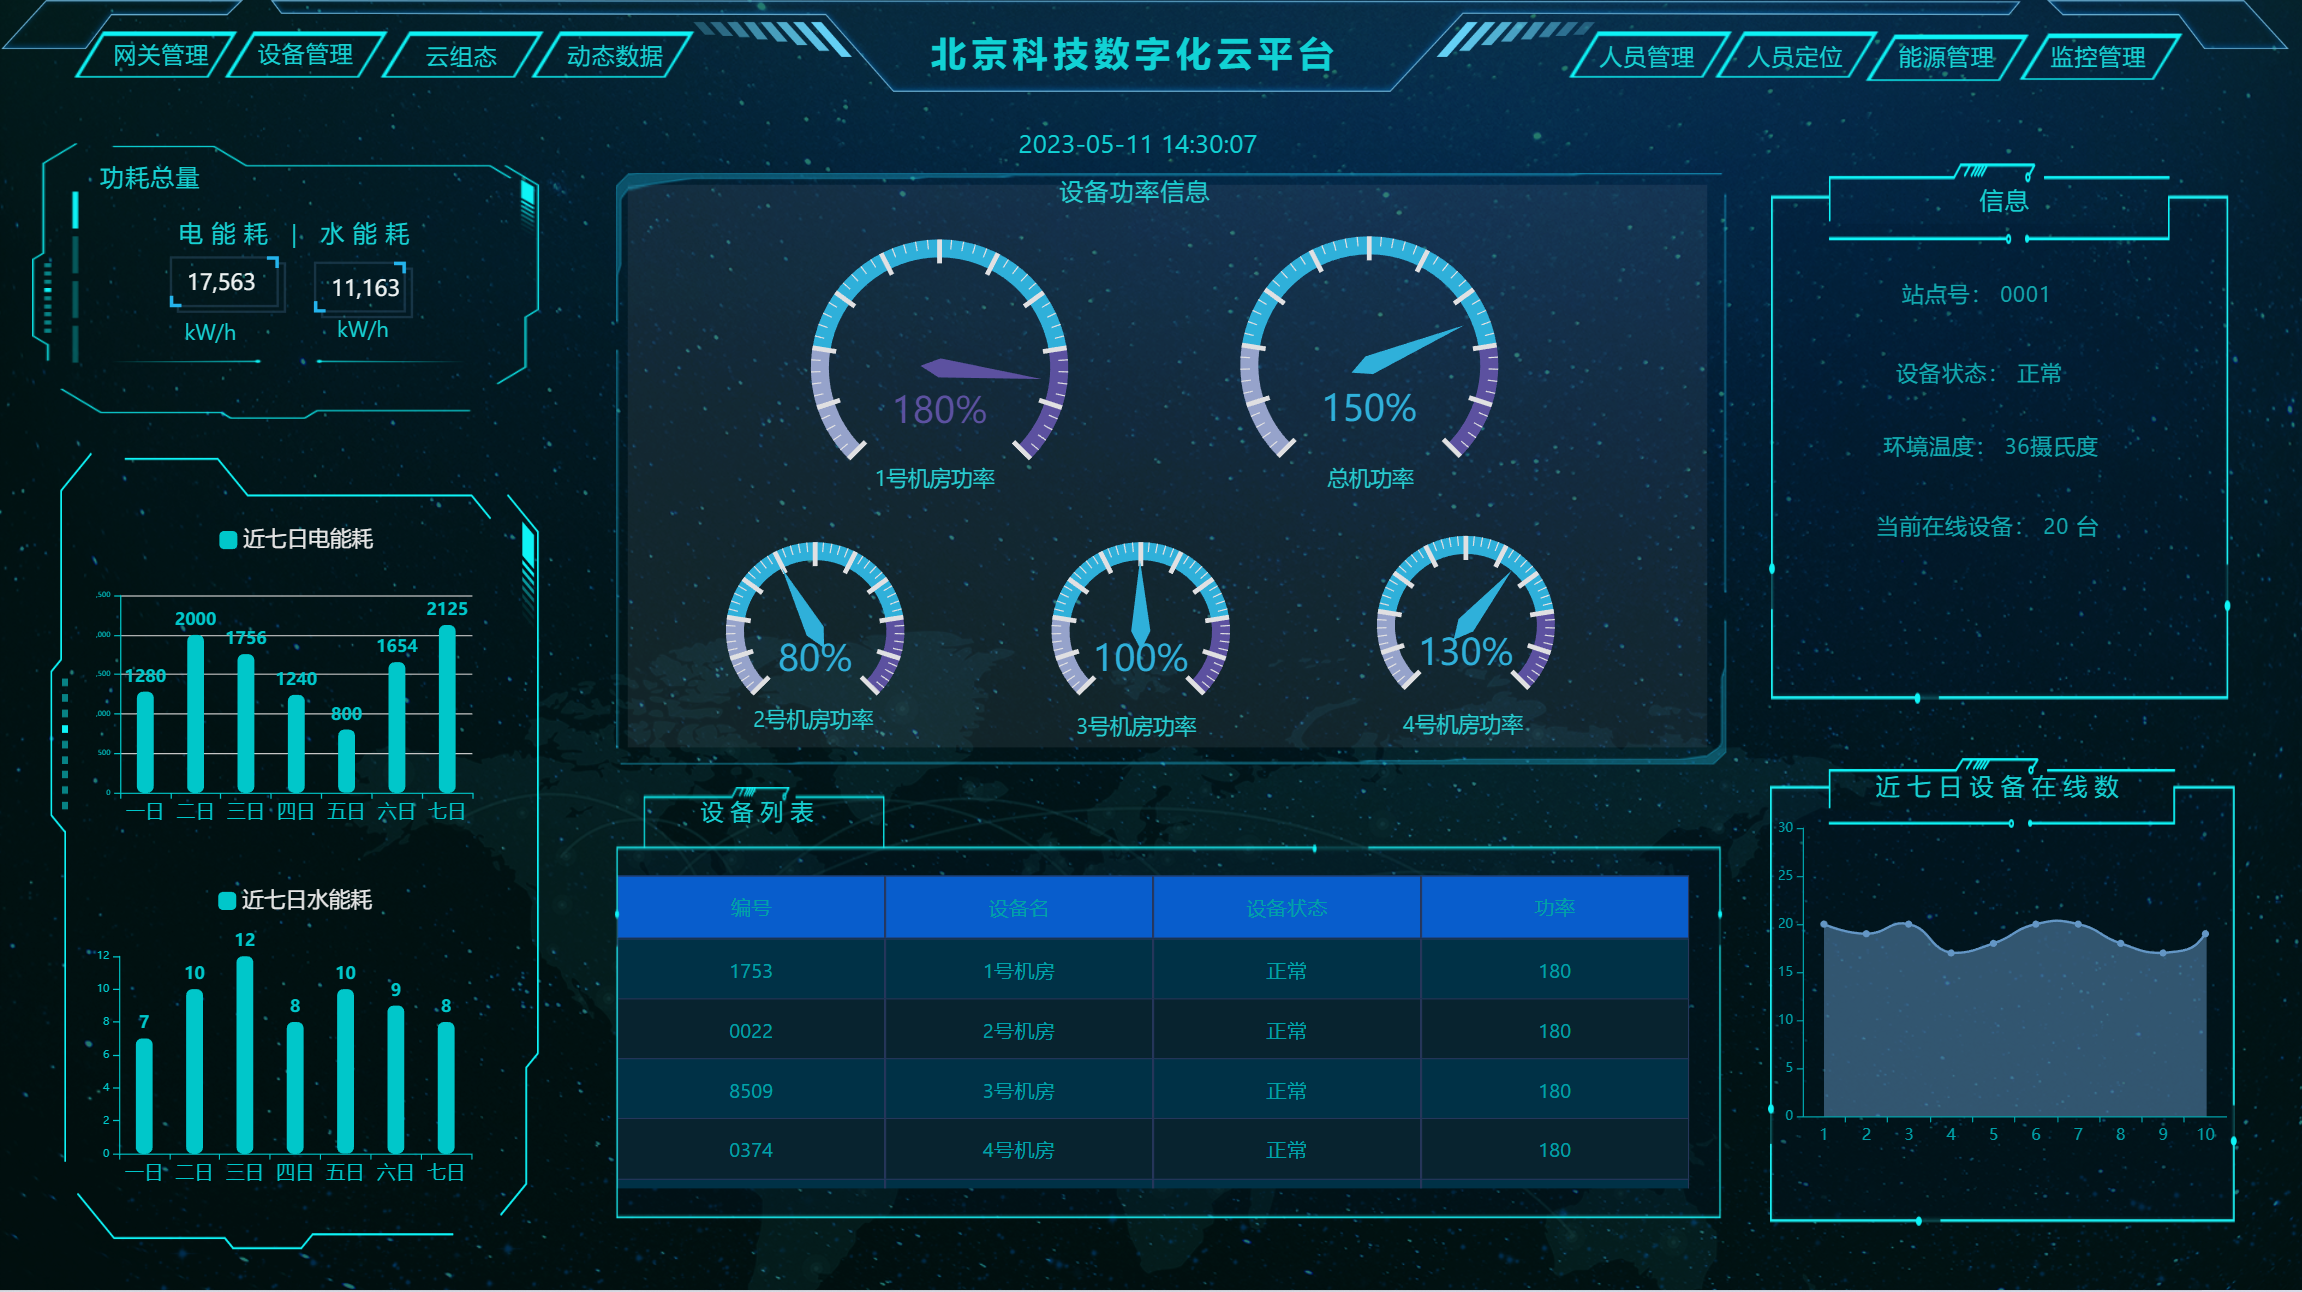
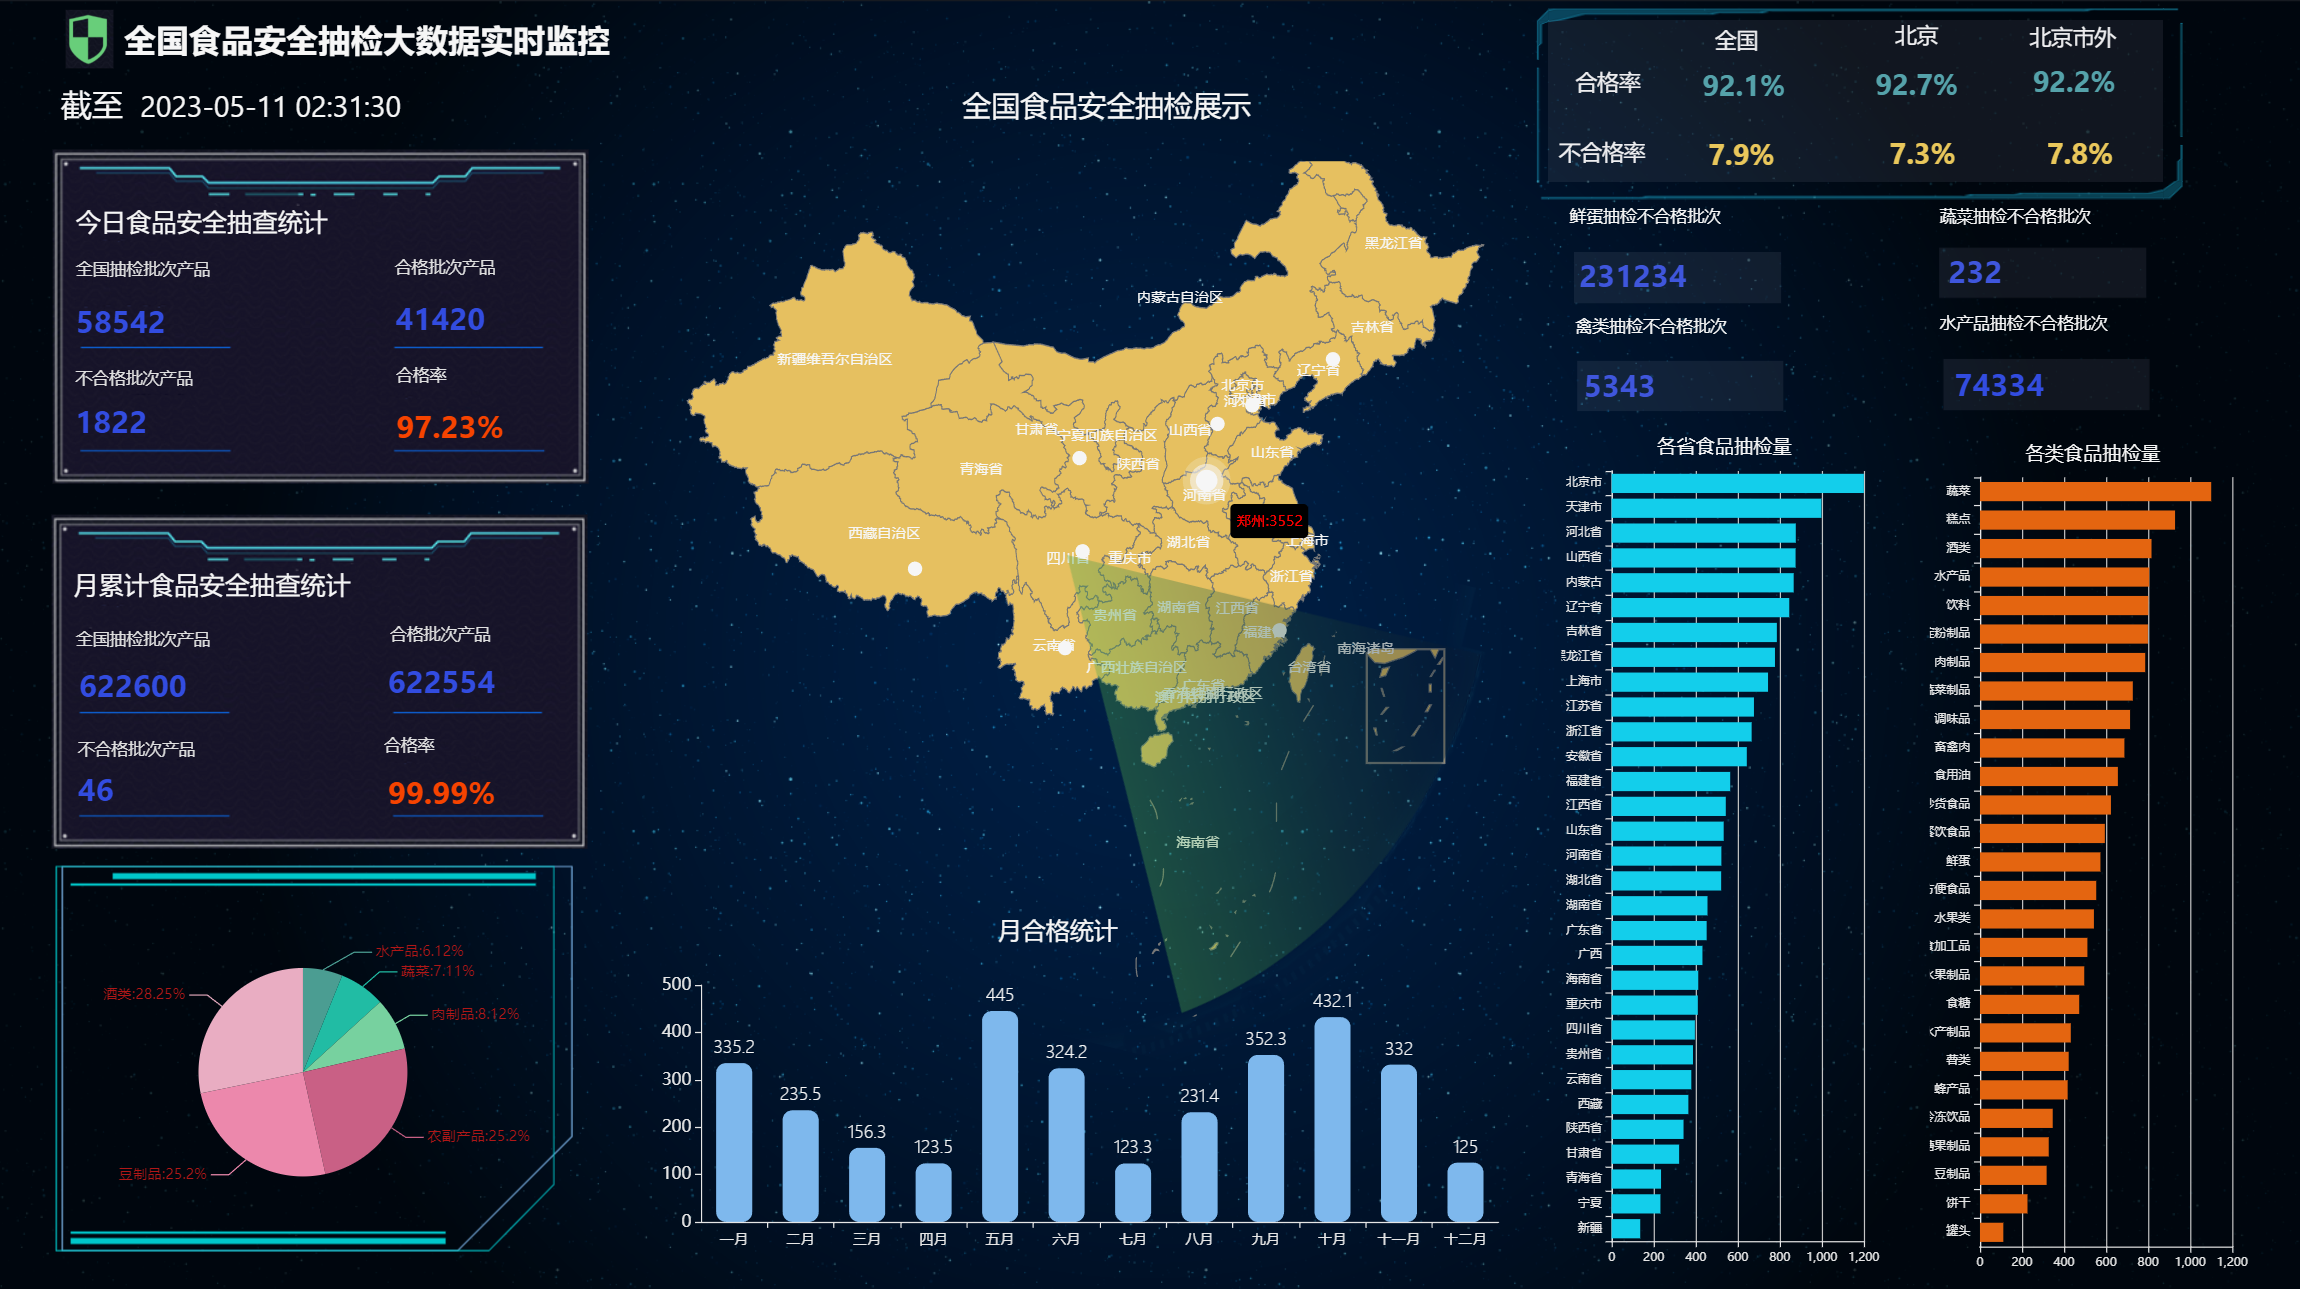
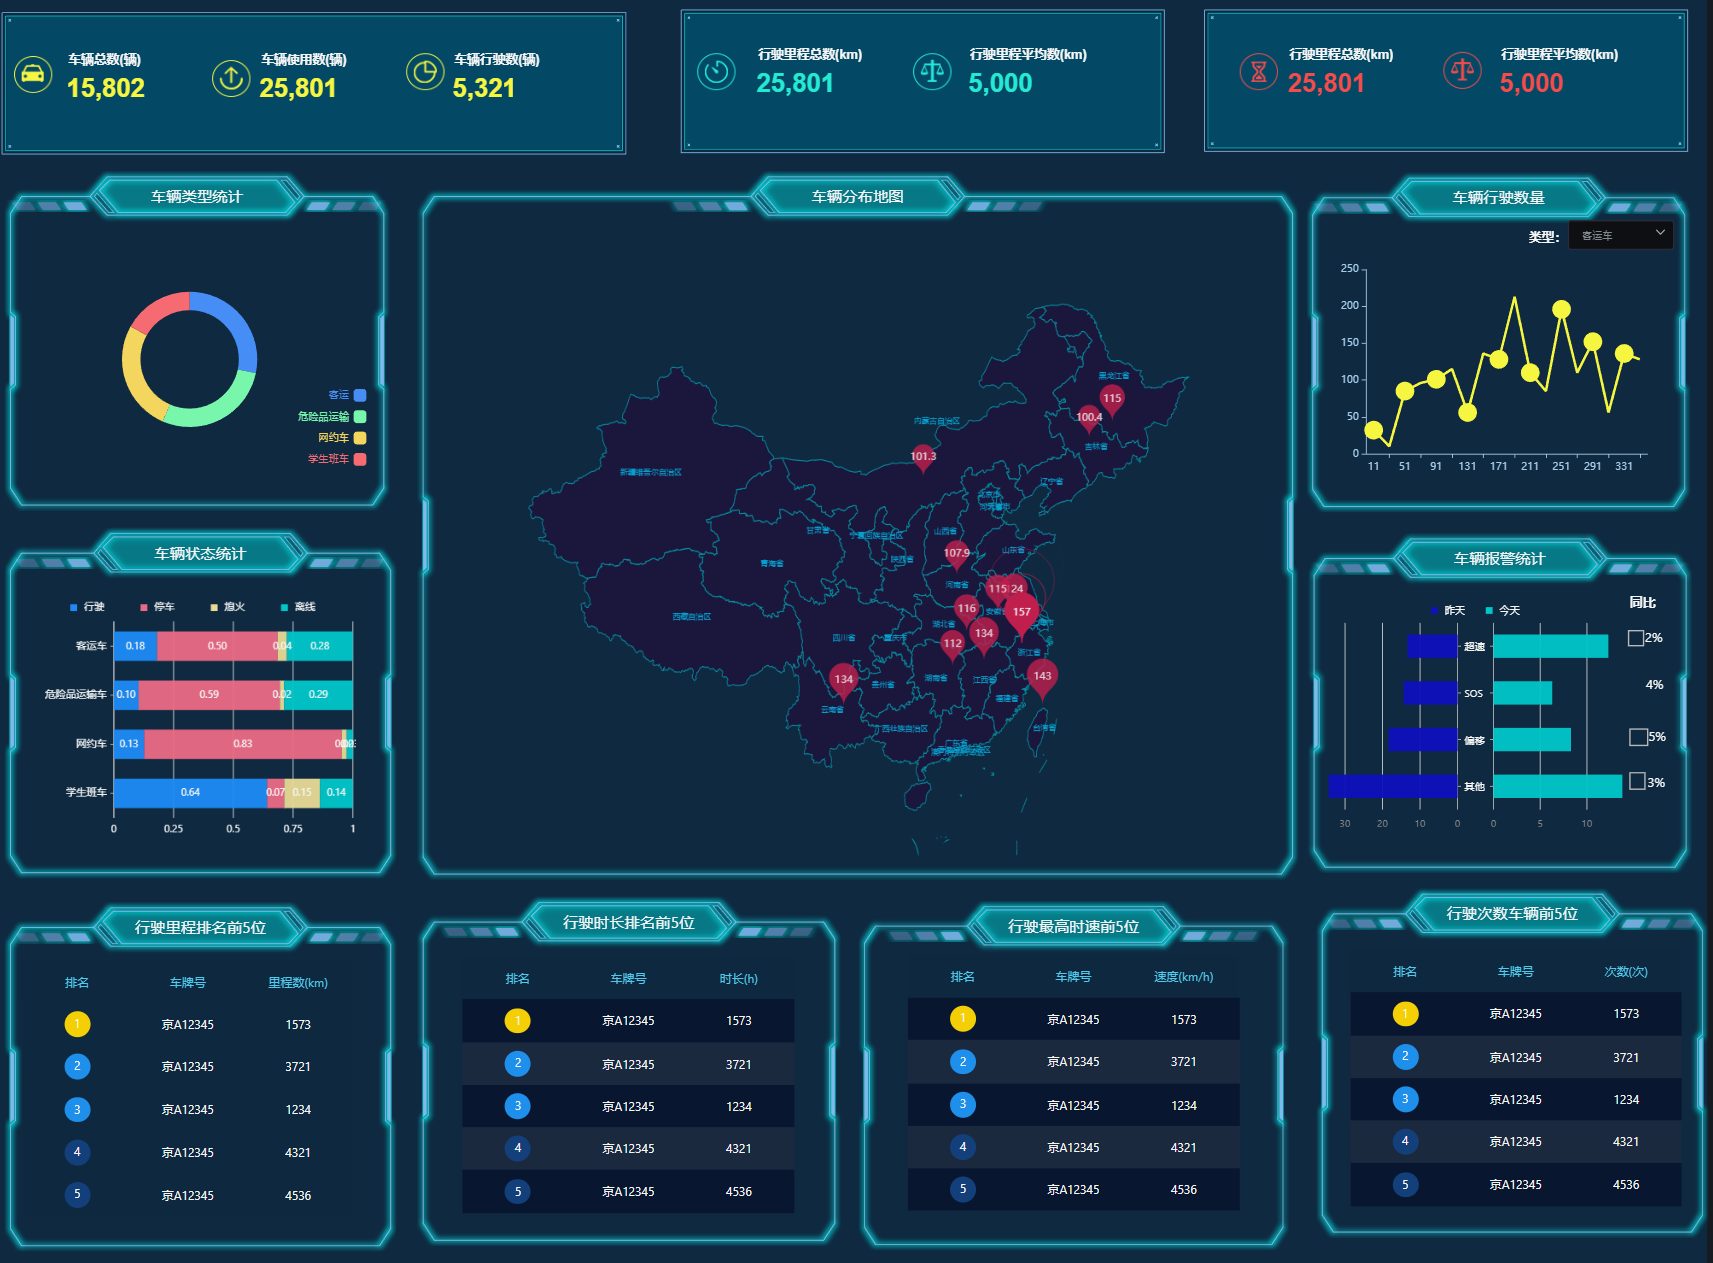
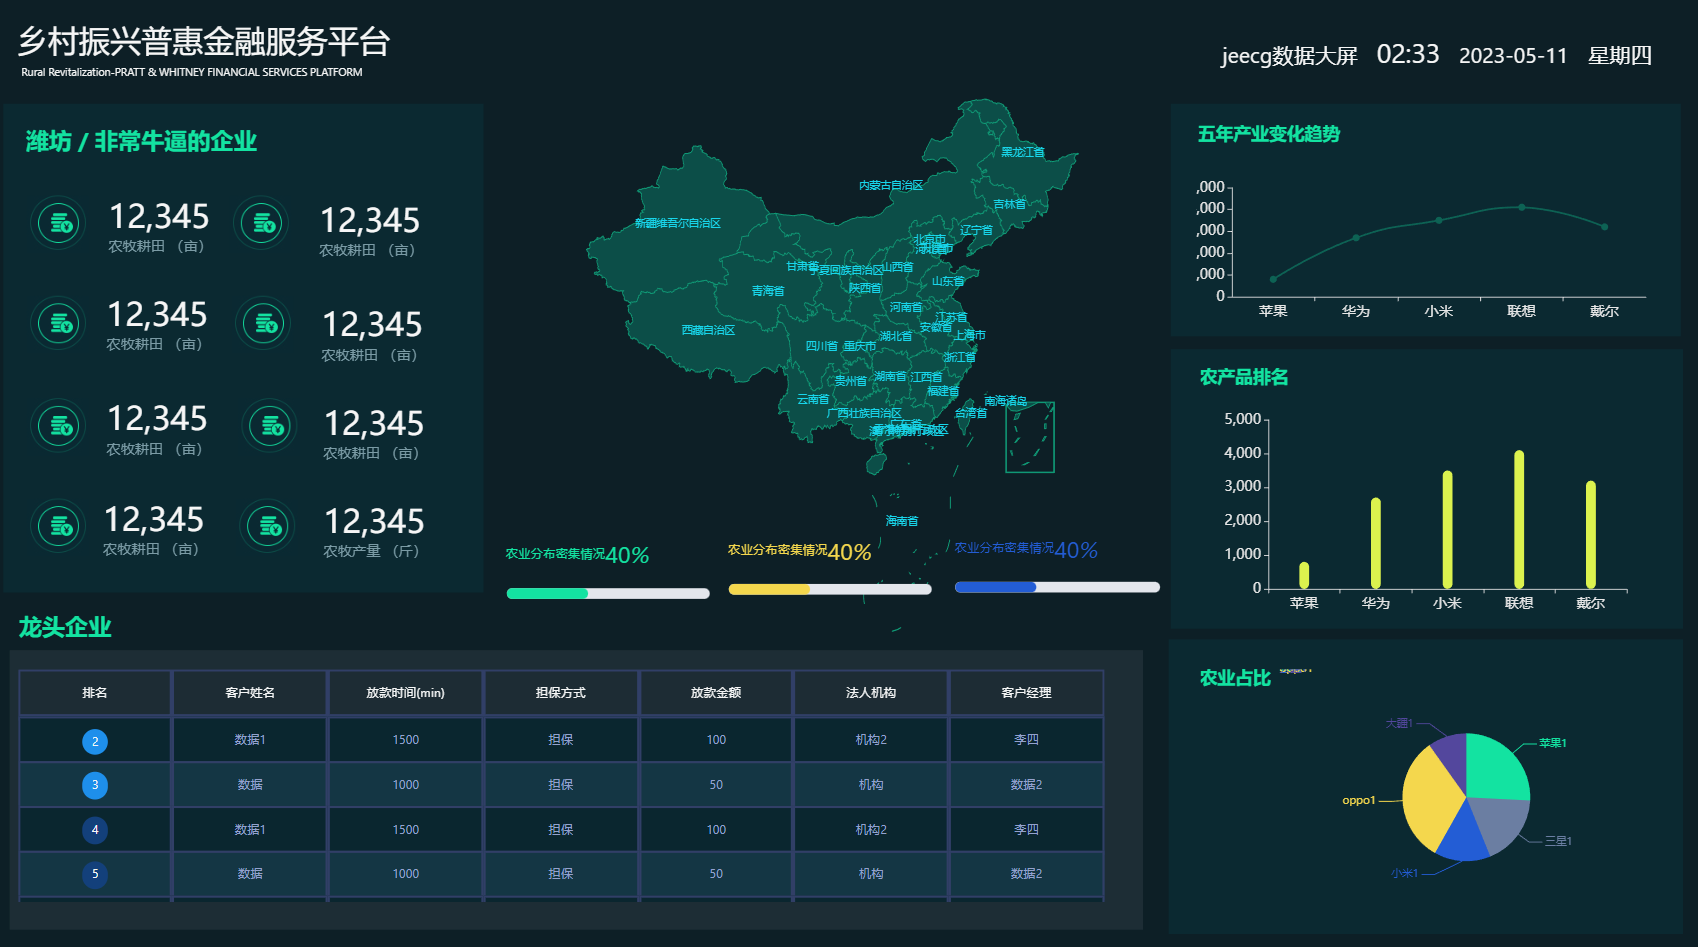
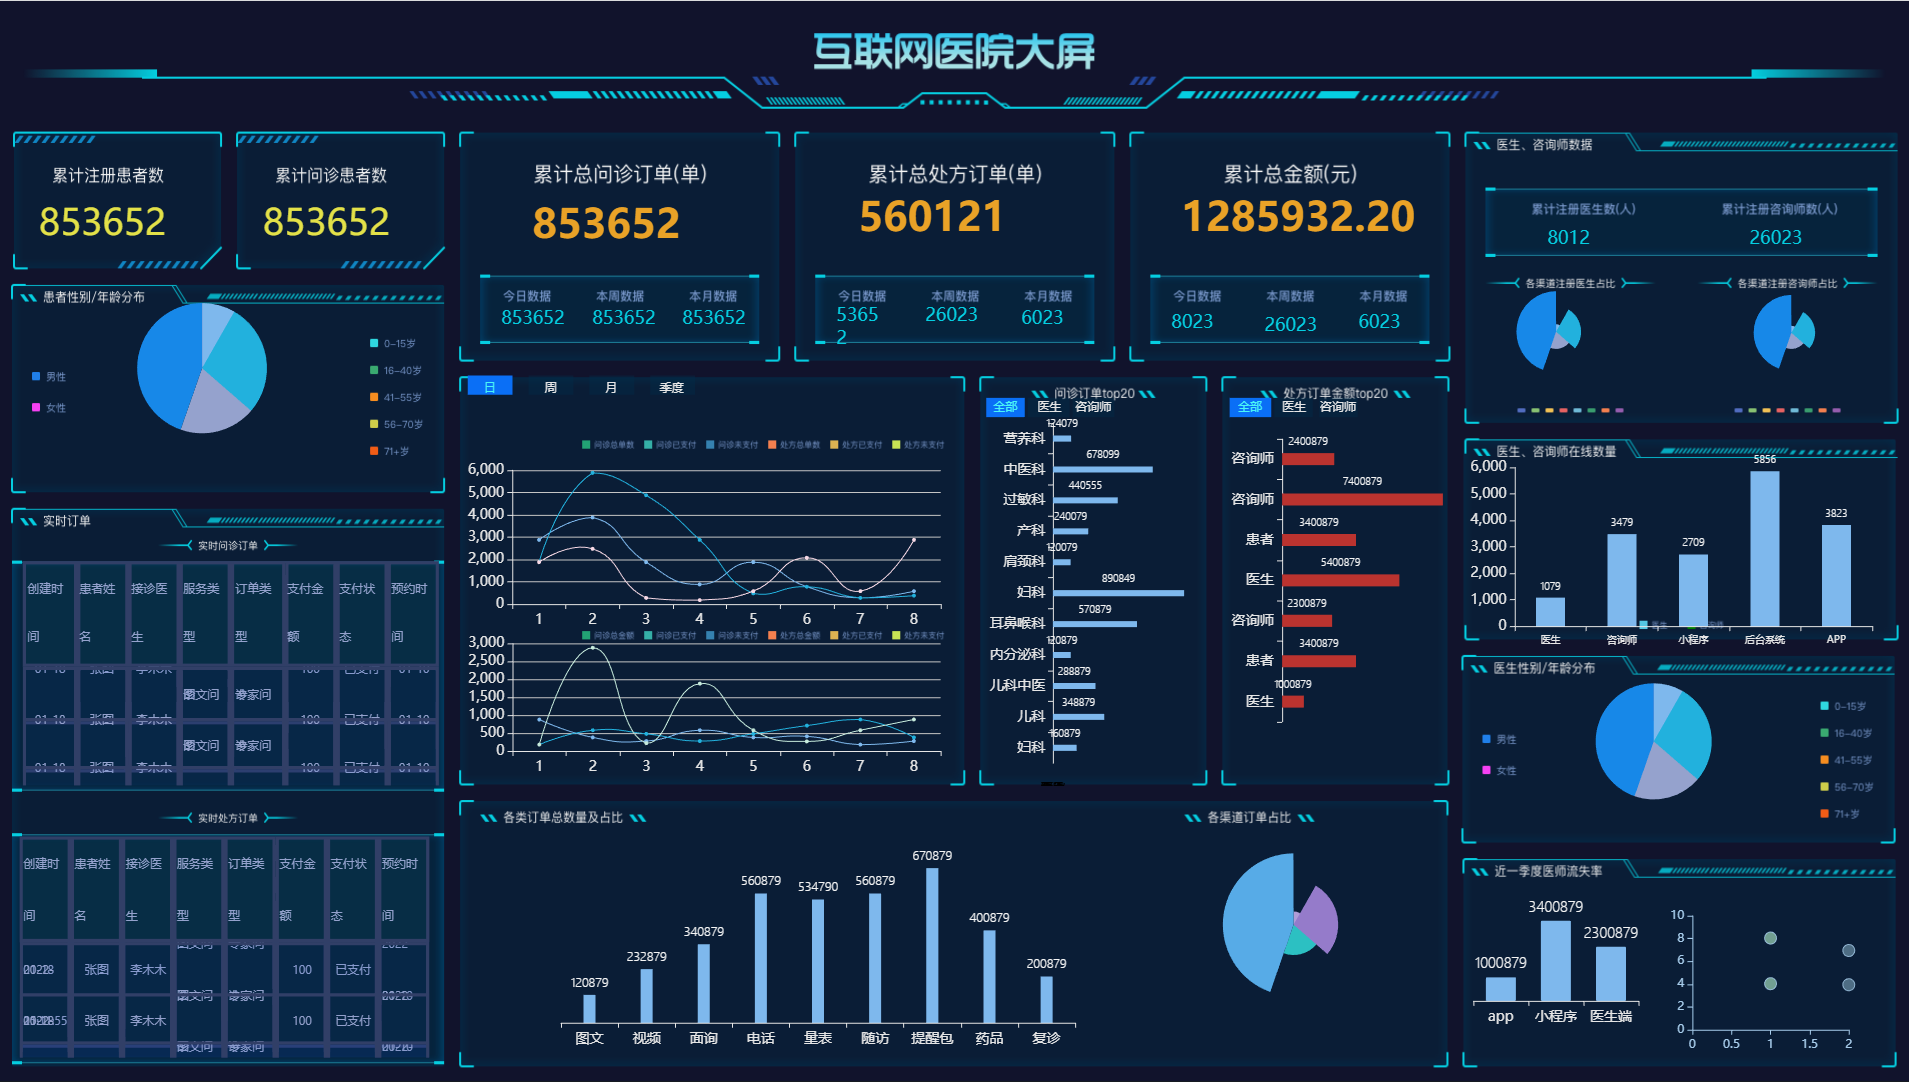
Big Screen Design Effects
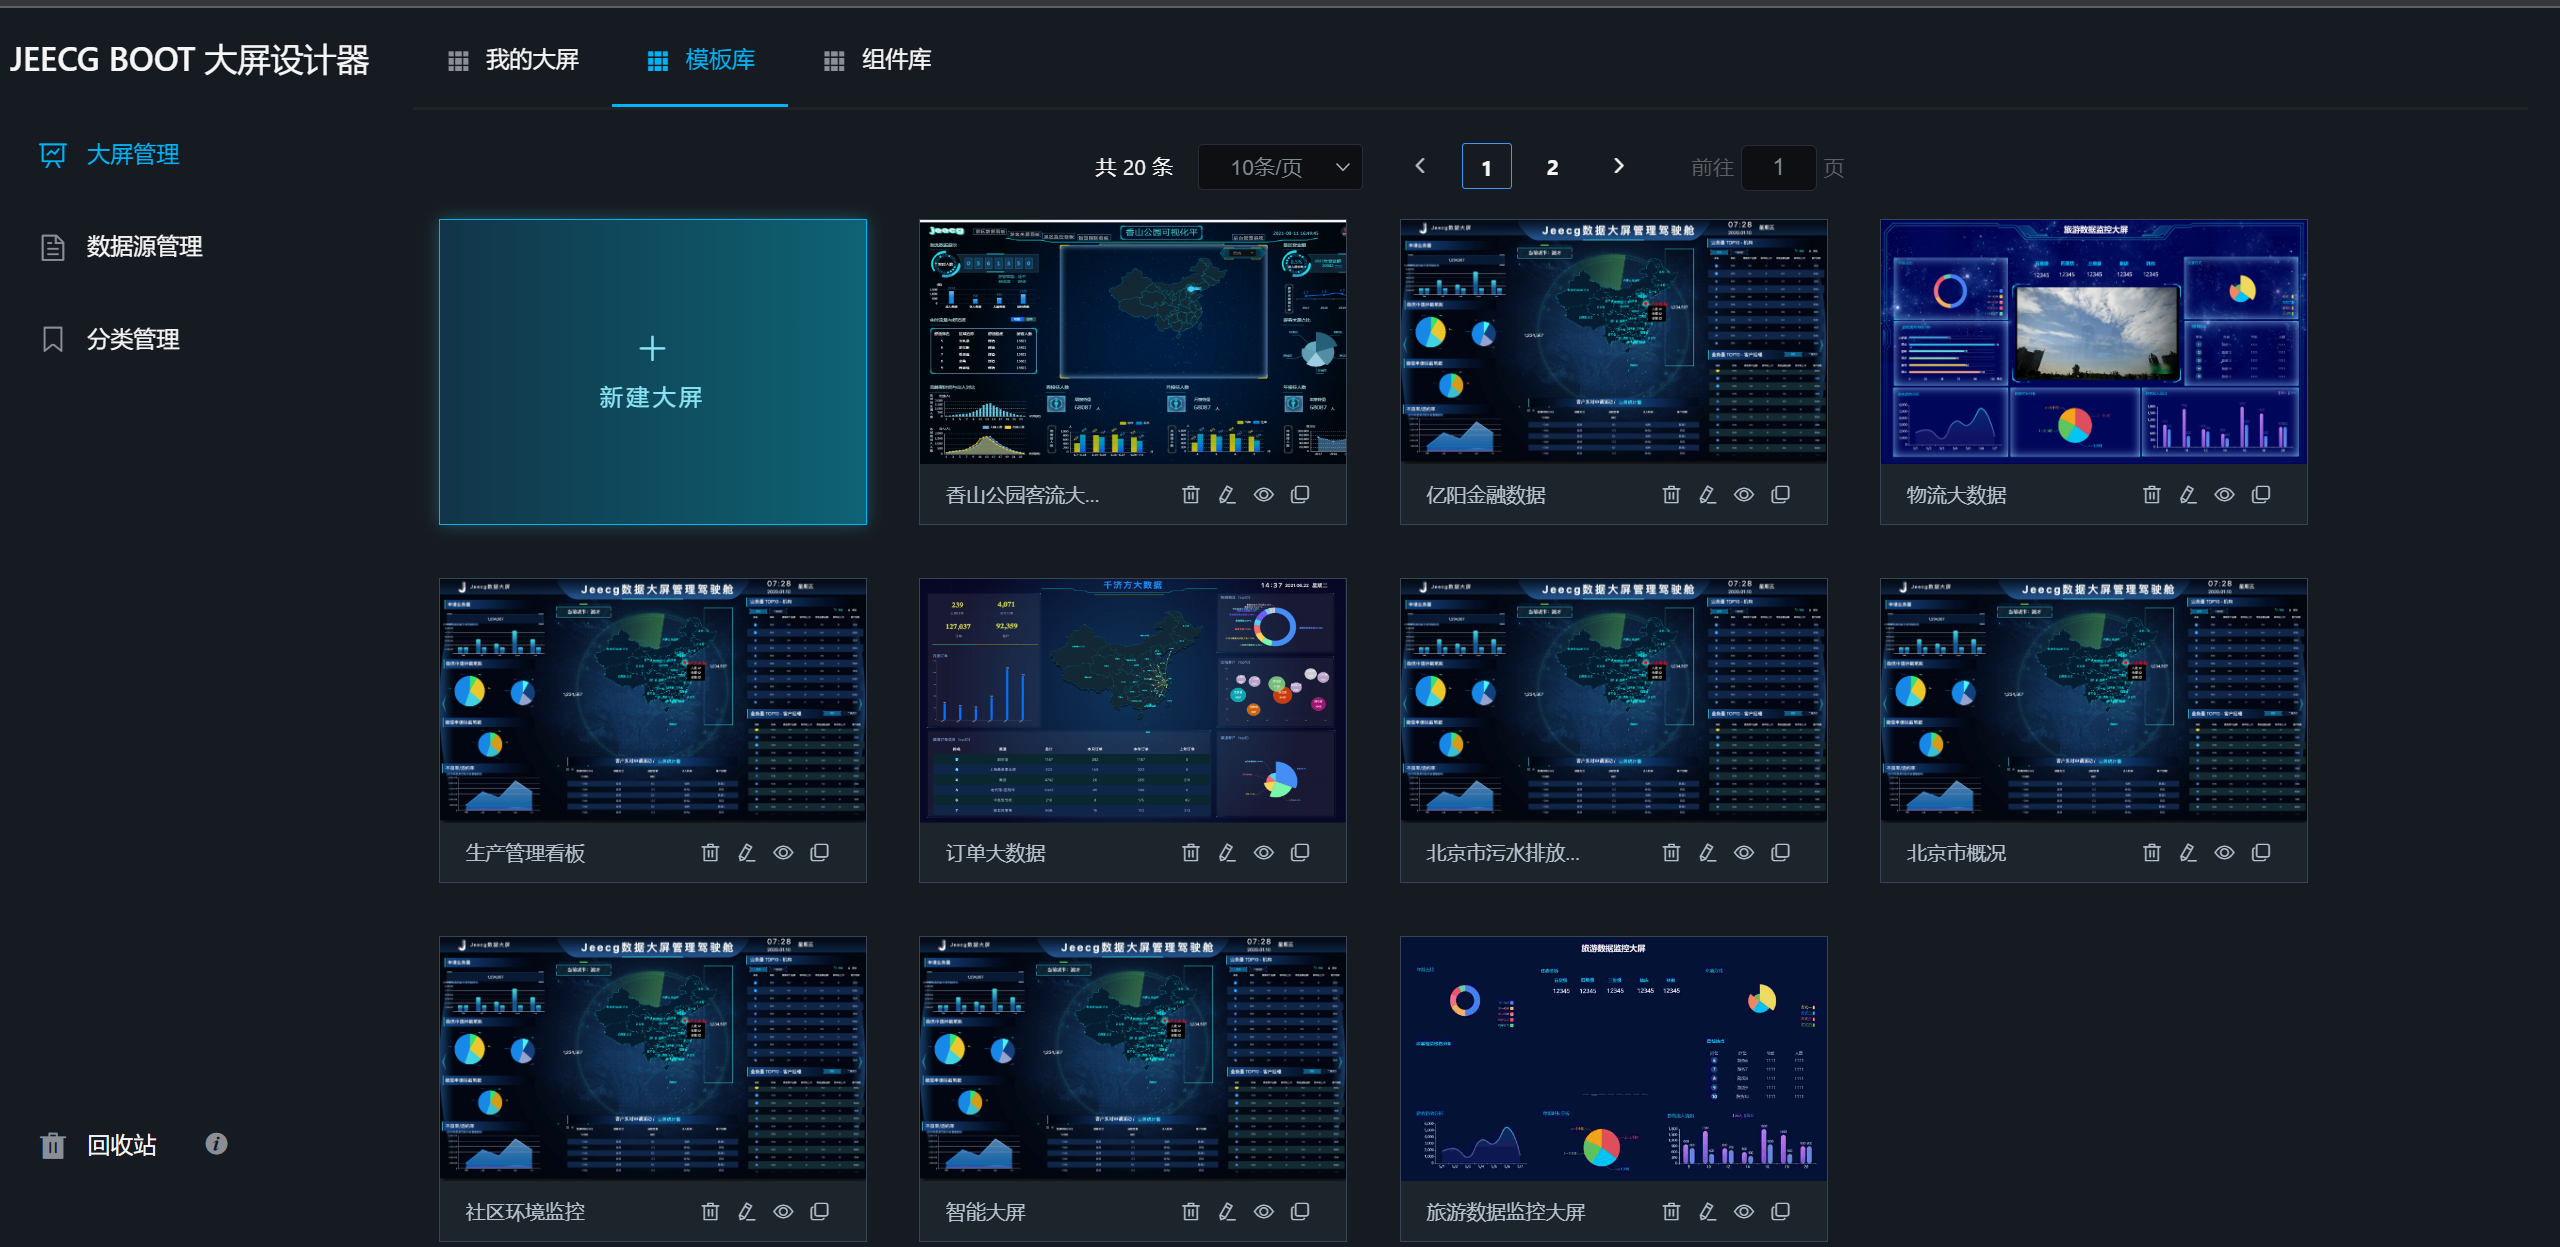 |
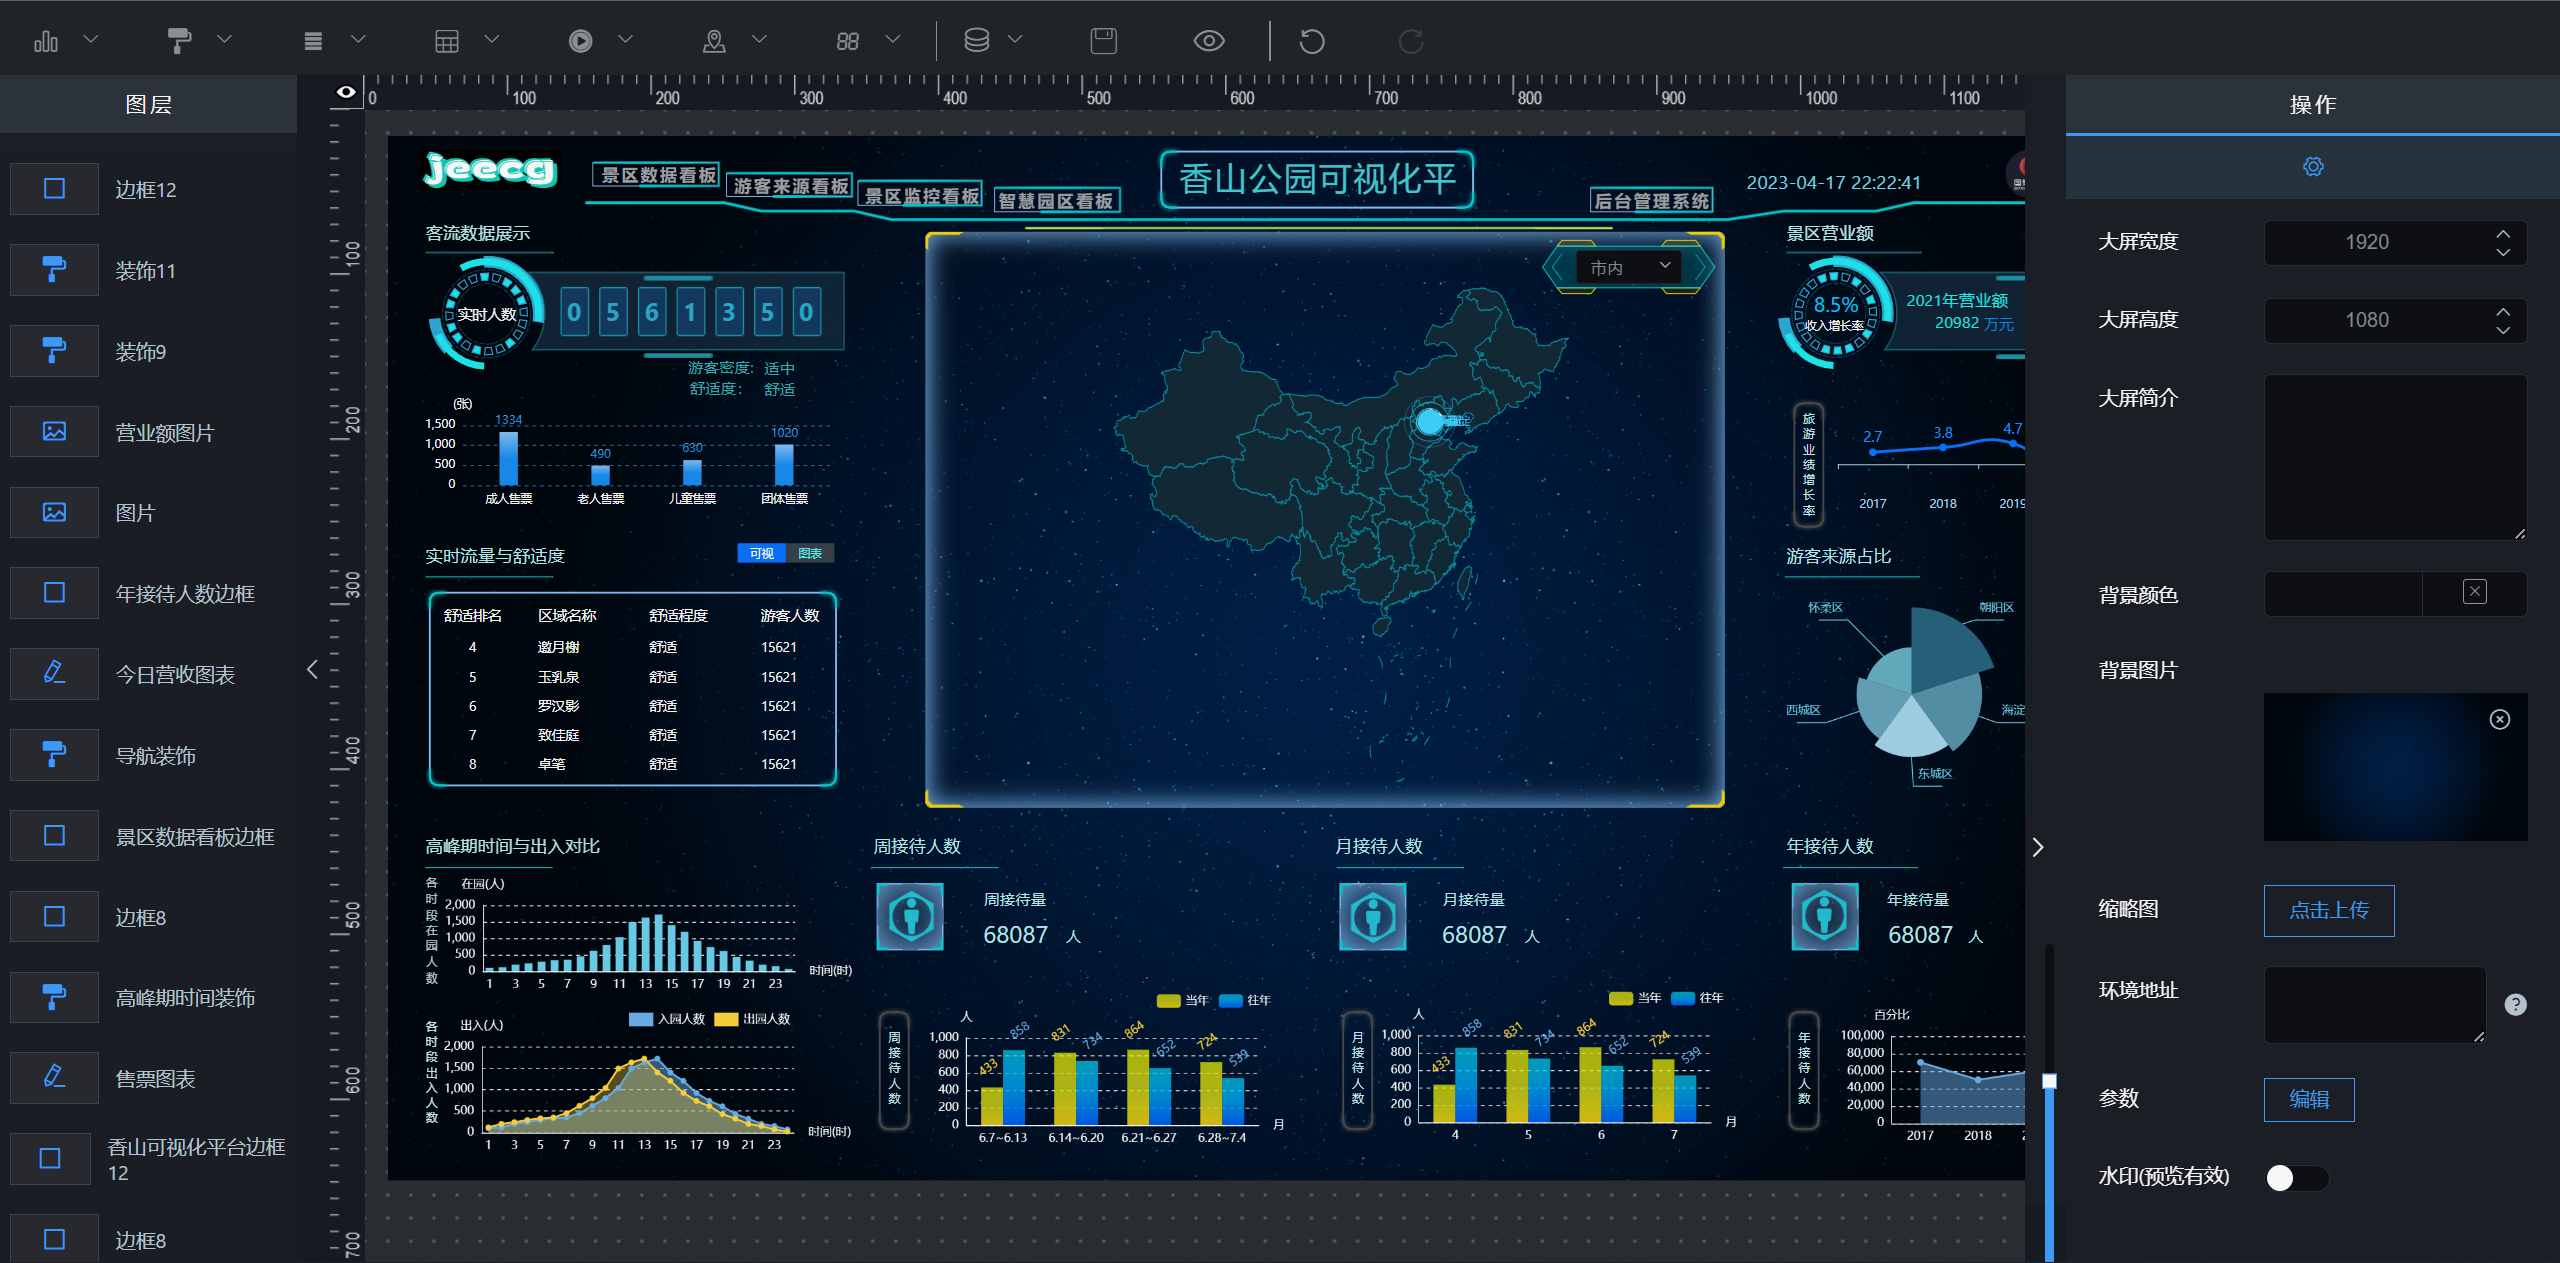 |
 |
 |
 |
 |
 |
 |
Full-screen Popup · click to pop up a list page |
Adaptive Dialog · the popped-up detail screen |
Auto Screen Switch · auto-switch every 5 minutes |
Gaode Maps · real-time vehicle locations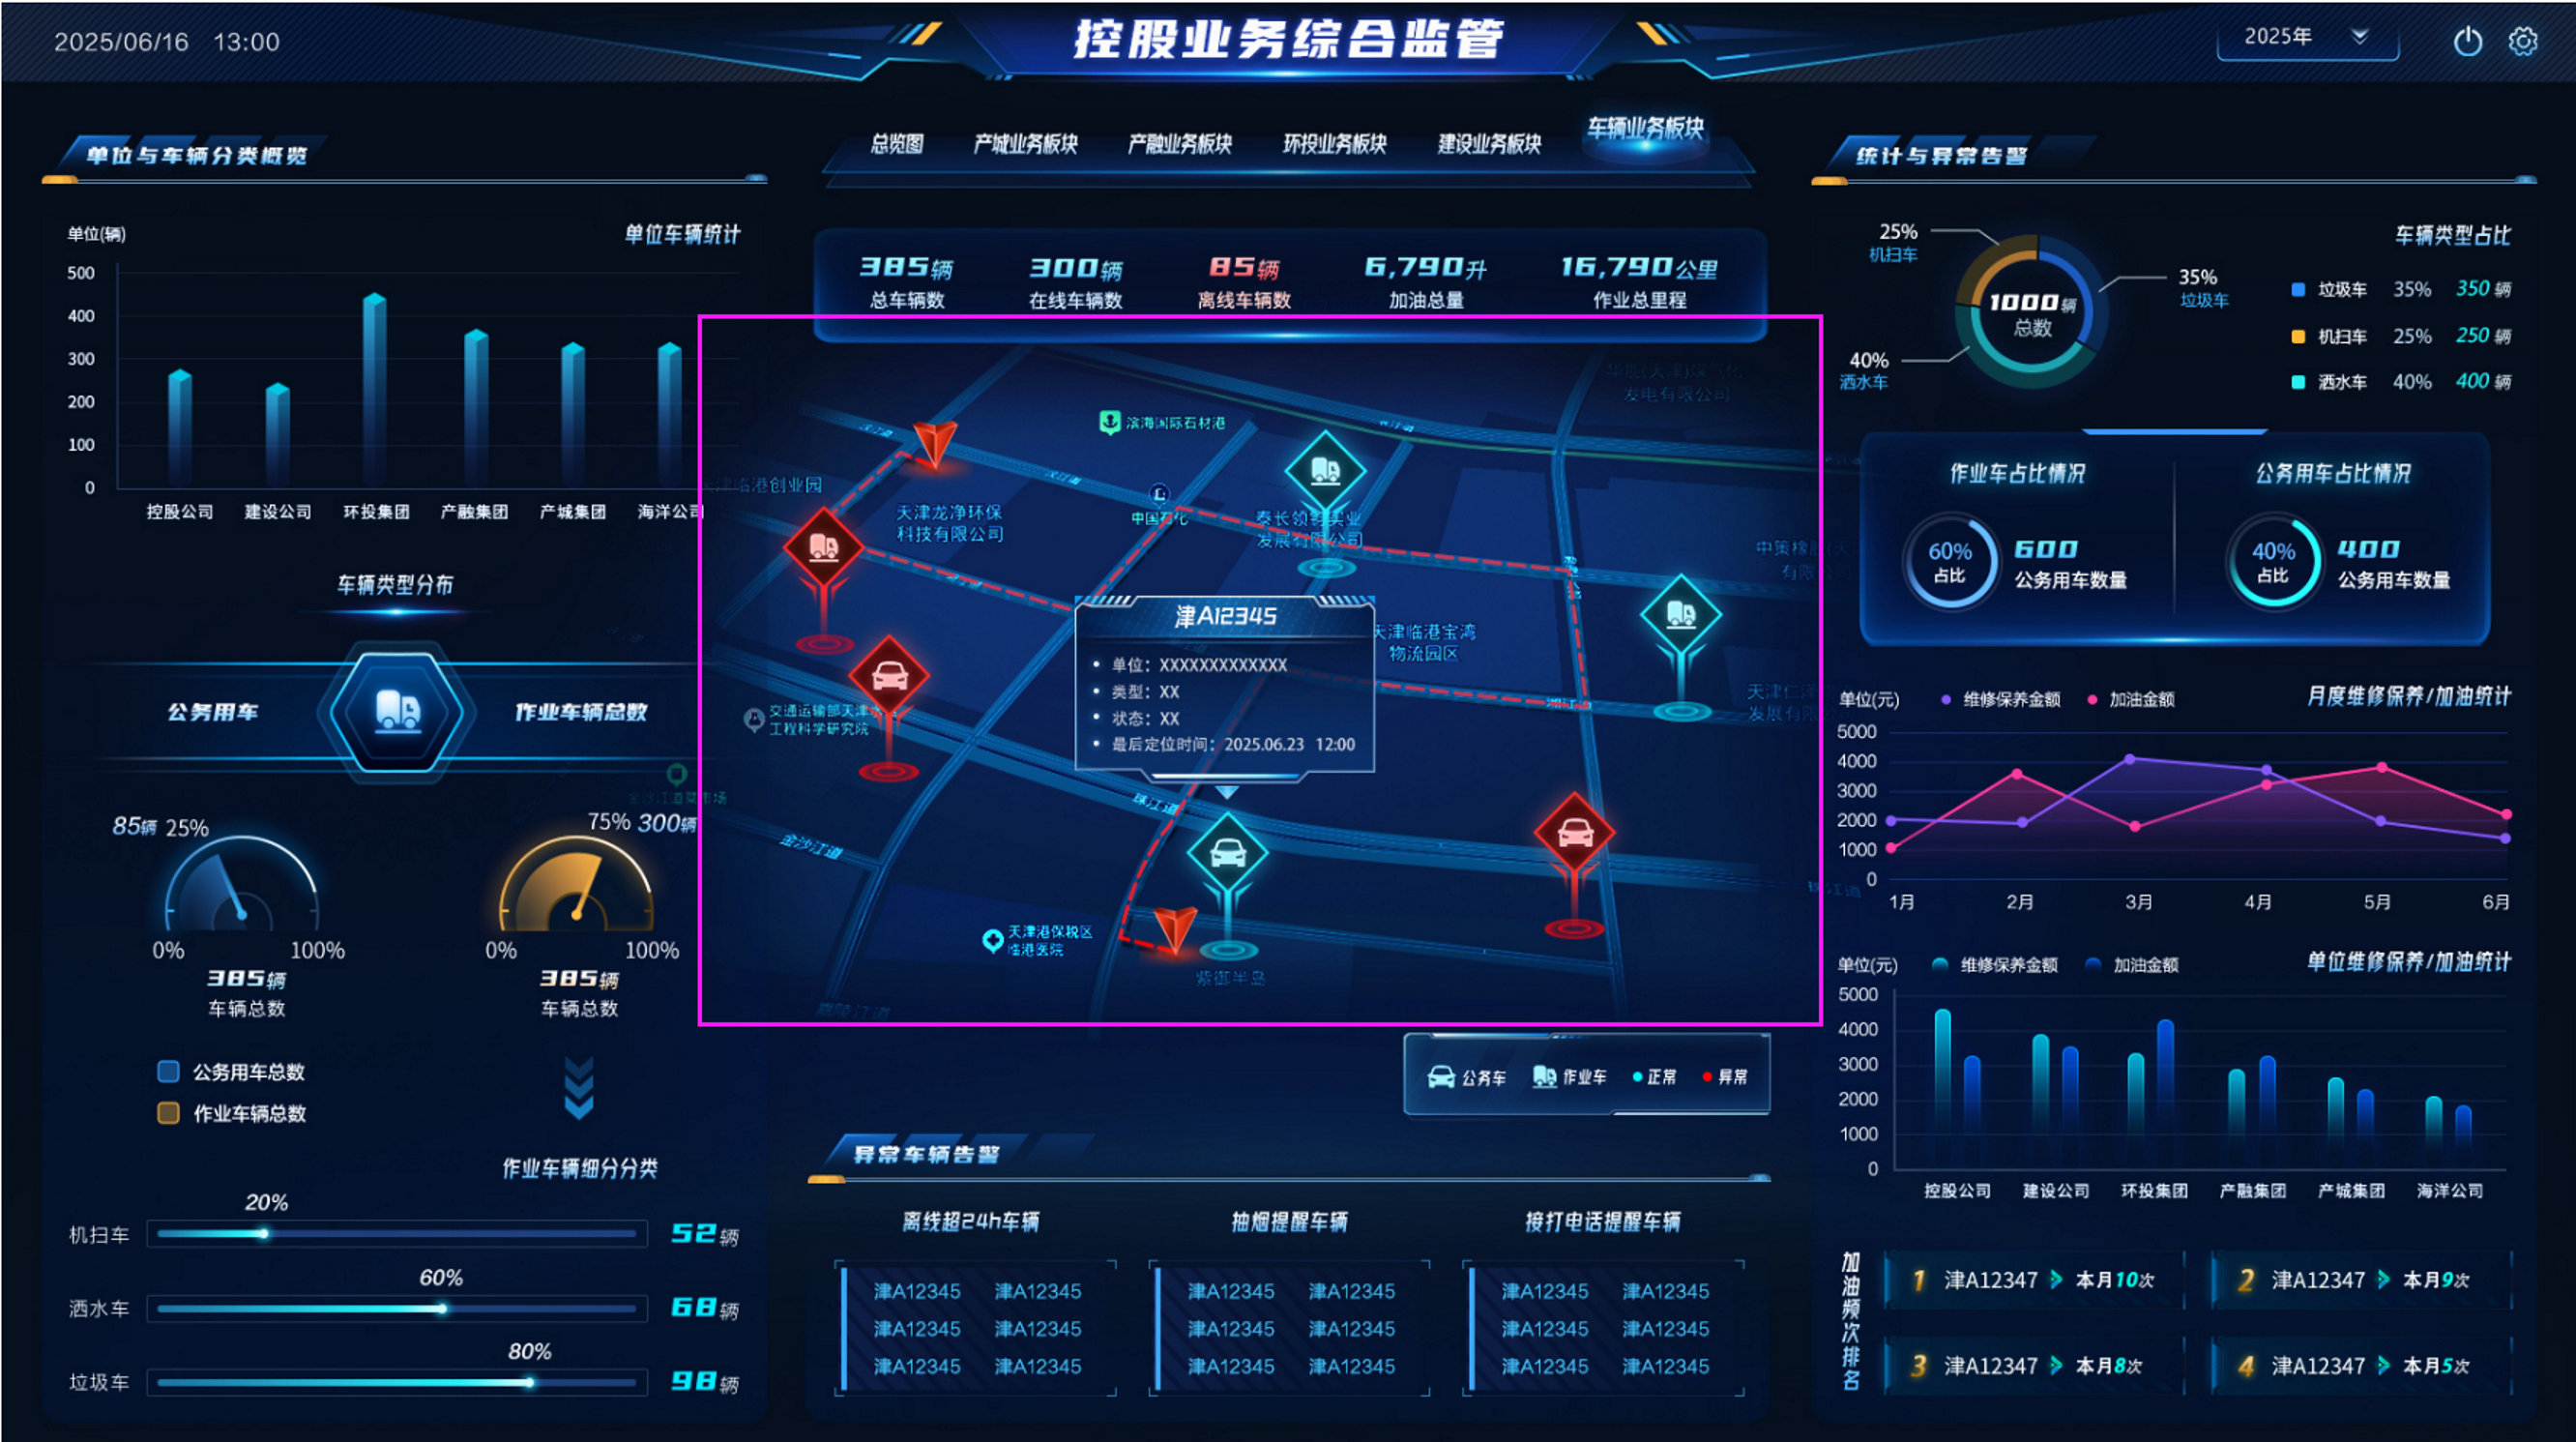 |
Dashboard and Portal Design
 |
 |
 |
 |
Mobile Dashboard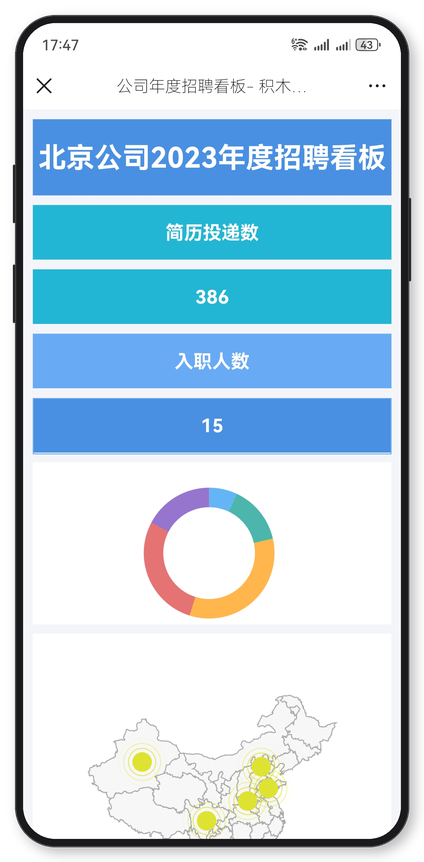 |
Mobile Portal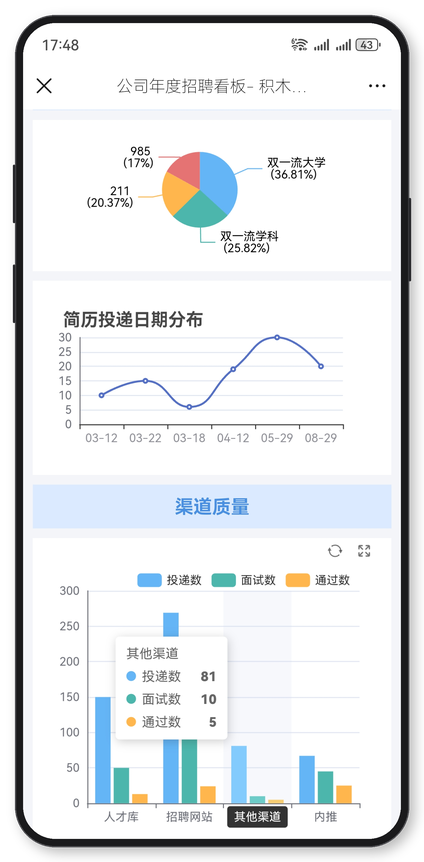 |
License
The open-source version is released under the LGPL license. If you cannot accept LGPL and need to use this project for commercial purposes without retaining copyright information (preview "Powered by JimuReport", "JimuReport Logo" and other copyright and links), you need to purchase a commercial license to protect your legal rights.
Donation
If you think it's not bad, please buy the author a cup of coffee ☺

Disclaimer
JimuReport is released under a dual-license model: the GPL-3.0 open-source license together with additional supplementary terms. For commercial licensing, please refer to http://jimureport.com/vip. Please read the following disclaimer carefully before using this software:
-
Provided "AS IS"
This software and its related documentation are provided "AS IS", without warranty of any kind, express or implied, including but not limited to warranties of merchantability, fitness for a particular purpose, and non-infringement. -
Use at Your Own Risk
Users shall evaluate whether this software meets their own business scenarios, and shall bear all risks arising from downloading, installing, using, modifying, or further developing this software, including but not limited to data loss, business interruption, loss of revenue, or any other form of damage. -
Limitation of Liability
To the maximum extent permitted by applicable law, the authors, contributors, and copyright holders of JimuReport shall not be liable for any direct, indirect, incidental, special, punitive, or consequential damages suffered by users or any third party arising from the use of this software. -
No Competing Products
Pursuant to Clause 2 of the "Supplementary Open-Source Terms" in theLICENSEfile, users are prohibited from modifying and repackaging this software to release or sell products with functionality similar to JimuReport, or from otherwise competing with JimuReport in the same software product market. Any such conduct constitutes infringement, and the rights holder is entitled to demand cessation and claim compensation for resulting economic losses. -
Copyright Attribution Retention
Pursuant to Clause 3 of the "Supplementary Open-Source Terms" in theLICENSEfile, users must retain JimuReport's official copyright notices when deriving, integrating, or deploying this software, including but not limited to the "Powered by 积木报表" credit, the JimuReport logo, and related official links on preview pages.
By downloading, copying, installing, or otherwise using this software, you are deemed to have read, understood, and agreed to the foregoing disclaimer and all terms set forth in the LICENSE file.